BTC/USD Forex Signal: Bitcoin Price Surge To Continue
Image Source: Unsplash
Bullish view
- Buy the BTC/USD pair and set a take-profit at 112,500.
- Add a stop-loss at 107,000.
- Timeline: 1-2 days.
Bearish view
- Sell the BTC/USD pair and set a take-profit at 107,000.
- Add a stop-loss at 112,500.
(Click on image to enlarge)

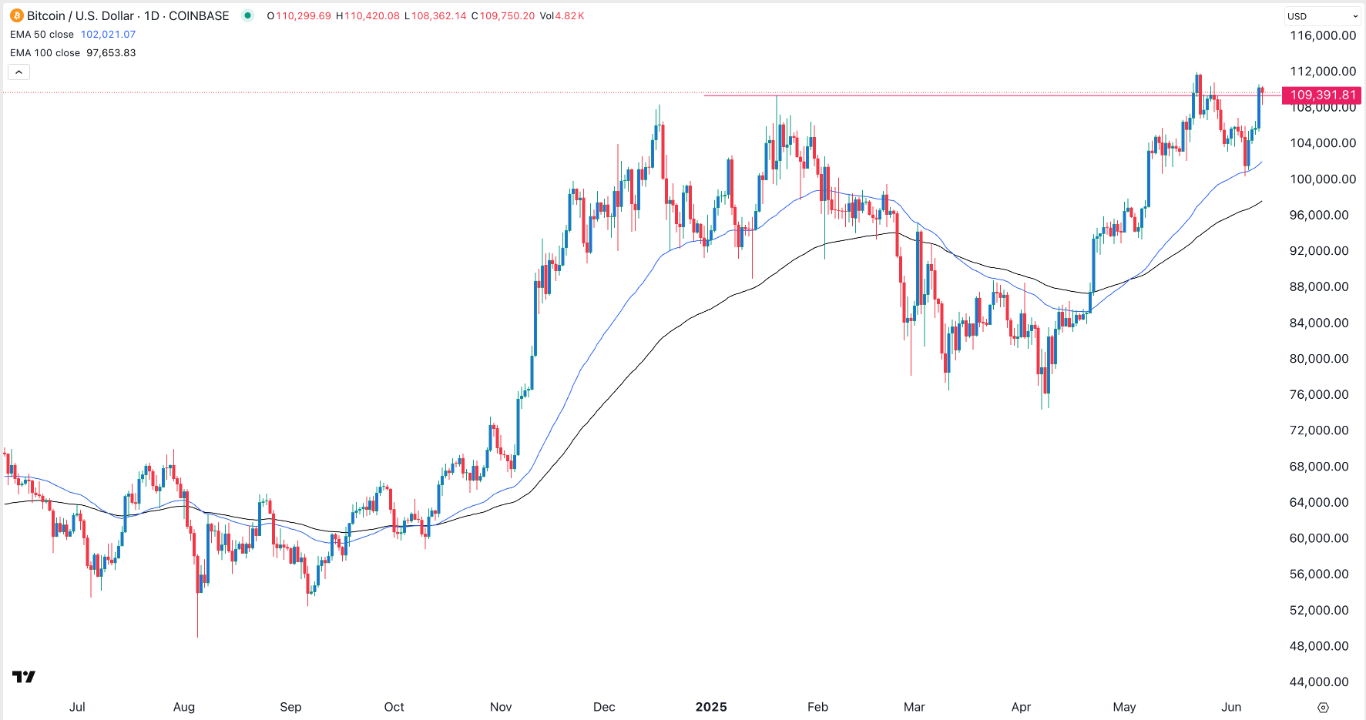
Bitcoin price is hovering near its all-time high as demand jumped and as supply continued falling. The BTC/USD pair was trading at 109,500, a few points below the all-time high of 111,900. It has jumped by almost 50% from its lowest level in April.
Bitcoin price has held steady in the past two months as demand has outweighed supply. Spot Bitcoin ETFs have continued to experience inflows, with the iShares Bitcoin ETF being the first fund to get to $70 billion into assets under management. All ETFs have added over $44.5 billion in inflows this year.
Companies are continuing to accumulate Bitcoin. Some of the most notable firms to boost their spending are Metaplanet, GameStop, and KULR Group, and more others are expected to do the same.
Bitcoin’s supply on exchanges has continued moving downwards this year. Santiment data shows that the supply has now plunged to 1.1 million from the year-to-date high of 1.5 million. Falling supply and rising demand
The next important catalyst for the BTC/USD pair will come from the United States, where the Bureau of Labor Statistics (BLS) will publish the latest inflation data.
Economists expect the data to show that the headline Consumer Price Index (CPI) rose to 2.5% from 2.3%, while the core figure moved to 2.9% as the impact of Trump’s tariffs emerged.
BTC/USD technical analysis
The daily chart shows that Bitcoin price is hovering at an important resistance level, which was the previous all-time high. This price is also along the upper side of the cup-and-handle pattern, a popular bullish continuation sign.
It has already completed the formation of the cup and is nearing the end of the handle section. The pair has remained above the 50-day and 100-day Exponential Moving Averages (EMA).
Therefore, the pair needs to cross the all-time high of 111,900 to invalidate the double-top pattern. A move above that level will point to more gains, potentially to the psychological point at 115,000.
More By This Author:
Here’s Why The Tilray Brands Stock Has Crashed, And What’s Next?
Nio Stock Price Analysis: Chart Signals A Bullish Breakout
AUD/USD Forex Signal - Slow Uptrend To 0.6600 To Continue
Disclosure: DailyForex will not be held liable for any loss or damage resulting from reliance on the information contained within this website including market news, analysis, trading signals ...
more


