BTC/USD Forex Signal: Bitcoin Price Rally Loses Momentum
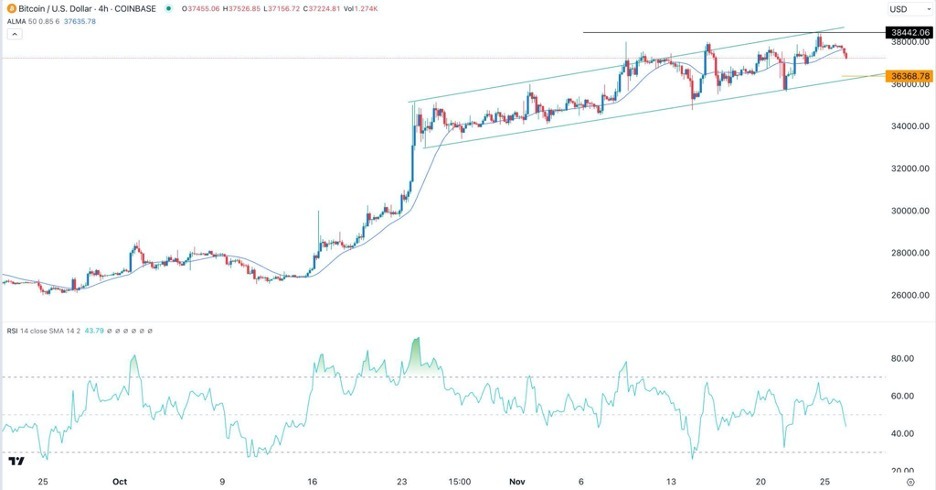
The 4H chart shows that the BTC/USD pair has formed an ascending channel in the past two months.
Bearish view
- Sell the BTC/USD pair and set a take-profit at 36,300.
- Add a stop-loss at 38,445.
- Timeline: 1-2 days.
Bullish view
- Set a sell-stop at 37,500 and a take-profit at 38,445.
- Add a stop-loss at 36,400.
Bitcoin price surged to over $38,442 during the weekend, the highest point since April 2022. The BTC/USD pair retreated to a low of 37,260 on Monday morning, the lowest level since November 23rd. It has risen by almost 10% from the lowest point in November.
Bitcoin’s momentum fades
Bitcoin price continued its bullish momentum even after the crypto industry went through numerous regulatory challenges. Last week, the Securities and Exchange Commission (SEC) filed a lawsuit against Kraken, one of the biggest crypto exchange in the world.
The SEC alleged that the company commingled customer funds and operated as an unregistered securities exchange. In another regulatory setback, Binance reached a major settlement with the SEC. It agreed to pay over $4 billion and completely exit the American market. Changpeng Zhao, the company’s CEO also agreed to pay $50 million and exit his role.
Analysts believe that the settlement is a positive thing for the industry since it removes one of the biggest challenges that has existed in the past few months. The settlement also means that Kraken and Coinbase could also decide to settle with the SEC.
Bitcoin’s price action has coincided with the recent US dollar index (DXY) crash. The DXY index has plunged to $103.41, much lower than the year-to-date high of $107.35. Similarly, the closely-watched VIX index has also dropped to $13, the lowest point since 2020.
This price action is a sign that investors have embraced a risk-on sentiment as global inflation retreats. The most recent data showed that the headline Consumer Price Index (CPI) retreated to 3.2% in October.
Inflation likely retreated in November as the price of crude oil has drifted downwards recently. Brent, the global benchmark, has dropped to $80 while the West Texas Intermediate (WTI) moved to $75.17.
BTC/USD technical analysis
The 4H chart shows that the BTC/USD pair has formed an ascending channel in the past two months. It rose and retested the upper side of the channel on Sunday. The pair has now moved below the 50-period Arnaud Legoux Moving Average (ALMA). Also, the Relative Strength Index (RSI) has crossed the neutral point of 50.
Therefore, the outlook for the pair is bearish, with the next point to watch being the lower side of the channel at 36,370. The stop-loss of this trade is at 38,445.
(Click on image to enlarge)

More By This Author:
Weekly Forex Forecast - Sunday, Nov. 26Trading Support And Resistance - Sunday, Nov. 26
EUR/USD: Weekly Forecast November 26 - December 2
Disclosure: DailyForex will not be held liable for any loss or damage resulting from reliance on the information contained within this website including market news, analysis, trading signals ...
more


