BTC/USD Forex Signal: Bitcoin Price On Edge, But A Rebound Likely
Bullish view
- Buy the BTC/USD pair and set a take-profit at 91,000.
- Add a stop-loss at 78,000.
- Timeline: 1-2 days.
Bearish view
- Sell the BTC/USD pair and set a take-profit at 78,000.
- Add a stop-loss at 91,000.
(Click on image to enlarge)
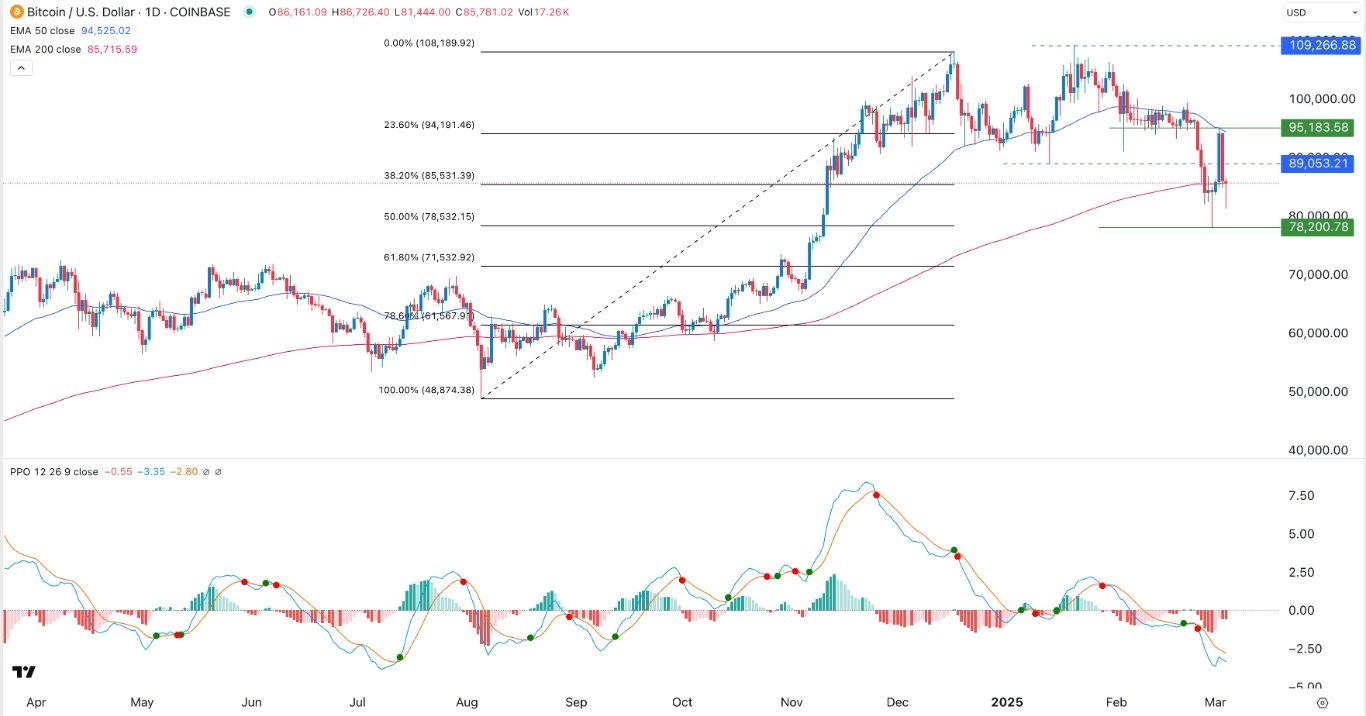
Bitcoin price remained under pressure overnight as a risk-off sentiment spread in the market following Donald Trump’s decision to impose tariffs on Canadian and Mexican goods. The BTC/USD pair retreated to a low of 81,600, much lower than this week’s high of 95,200.
Bitcoin price drops as risk-off sentiment continued
The BTC/USD pair dropped, mirroring the performance in the stock market crashed, erasing all post-election gains. Blue-chip indices like the Dow Jones, Nasdaq 100, and S&P 500 have all crashed by over 3% this week.
These indices dropped as the market adjusted to the new normal as the US launched a trade war with its closest trading partners. It launched a 25% tariff on most Canadian and Mexican goods. The US has also started implementing a 25% tariff on imported steel and aluminium.
These tariffs wil have a big impact on the US economy, including by stimulating inflation and leading to slow growth. Recent data shows that inflation has continued rising, and is hovering at around 3%. With the new tariffs, there is a likelihood that prices will keep soaring.
Bitcoin and stocks dropped since the market tends to overreact when there are major black swan events in the US. This can be categorized as a black swan event because the US and its neigboring countries have enjoyed a free trade area for decades.
On the positive side, the impact of these tariffs will be priced in by market participants, meaning that a rebound is possible. That’s because these tariffs will likely be followed by negotiations, which may end them soon. There are also signs that the tariffs will be blocked by American courts because of the USMCA deal.
BTC/USD technical analysis
The BTC/USD pair has retreated in the past few months, moving from the year-to-date high of 109,265 to 85,550. It has moved below the 23.6% Fibonacci Retracement level at 94,200 and the 50-day Exponential Moving Average (EMA). It has settled at the 200-day moving average and the 38.2% retracement point.
The Percentage Price Oscillator (PPO) have moved below zero. Therefore, the pair will likely maintain its volatility on Wednesday. A move below the support at 80,000 will point to more downside, potentially to the key support at 70,000. On the flip side, a move above the resistance at 90,000 will point to further upside.
More By This Author:
EUR/USD Forex Signal: Ascending Triangle Points To More UpsideEUR/USD Forex Signal: Double-Top Points To Further Downside
Ethereum Price Prediction: Is Another 50% Crash Possible?
Disclosure: DailyForex will not be held liable for any loss or damage resulting from reliance on the information contained within this website including market news, analysis, trading signals ...
more


