BTC/USD Forex Signal: Bitcoin Price Neutral Outlook With A Bullish Bias
Bullish view
- Buy the BTC/USD pair and set a take-profit at 29,000.
- Add a stop-loss at 27,200.
- Timeline: 1-2 days.
Bearish view
- Set a sell-stop at 27,400 and a take-profit at 26,000.
- Add a stop-loss at 29,000.
Bitcoin price has done well in the past two weeks even as risks in the financial market continued. The BTC/USD pair was trading at 28,000 on Monday, higher than last month’s low of 24,800.
Bitcoin is doing well
The BTC/USD pair has held quite steady in the past few weeks even as risks to the global economy continued. For example, America’s bond yields continued their remarkable sell-off last week, which pushed their yields to the highest points since 2007.
The 30-year yield was trading at 4.96% on Monday while the 10-year rose to 4.79%. In most periods, soaring yields and a yield curve inversion are usually signs of a recession.
Therefore, Bitcoin’s price action is notable since many investors are moving from risky assets to the safety of money market funds.
Bitcoin has also outperformed American stocks in the past few weeks. While its price has moved sideways, key indices like the Dow Jones and the Russell 2,000 indices have retreated sharply.
The BTC/USD pair reacted mildly to the latest American jobs data. These numbers revealed that the economy added over 336k jobs in September after creating over 227k in the previous month.
While the unemployment rate rose to 3.8% and wages slowed to 4.2%, the labor market is still strong. These jobs numbers led to a risk-off sentiment as the US dollar index (DXY) retreated to $105.8 while American equities jumped.
The next key catalysts that could move Bitcoin will be the latest Federal Reserve minutes and US inflation data. Economists expect the data to show that the headline CPI slipped from 3.7% in August to 3.6% in September even as gasoline prices rose.
BTC/USD technical analysis
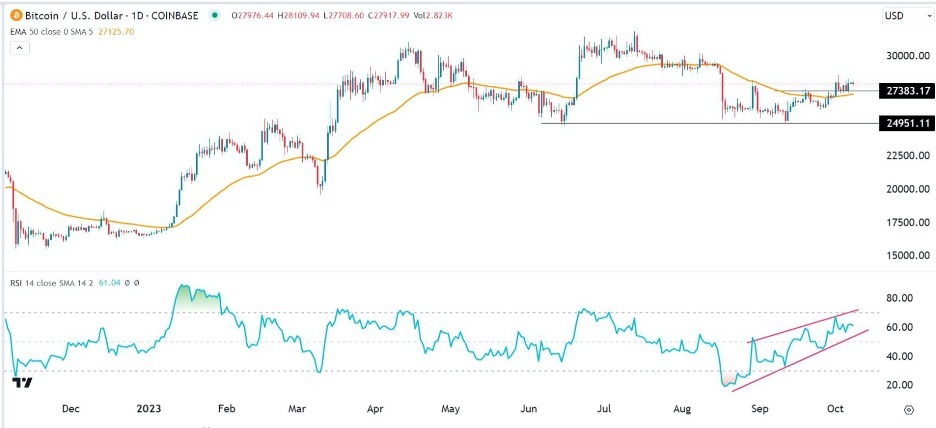
The BTC/USD pair has done well in the past few days. On the daily chart, it has moved slightly above the 50-day moving average while the Relative Strength Index (RSI) has continued rising. It is nearing the overbought level of 70.
The pair has also formed what looks like an inverted head and shoulders pattern, a common bullish sign. It is also above the crucial support level at 27,383, the highest point on September 19th.
Therefore, the pair will likely continue rising as buyers target the key resistance level at 29,000. The stop-loss of this trade will be at 27,000.
(Click on image to enlarge)

More By This Author:
Trading Support And Resistance - Sunday, Oct. 8BTC/USD Forex Signal: On the Cusp of a Bullish Breakout
EUR/USD Technical Analysis: Compensating For Sharp Losses
Disclosure: DailyForex will not be held liable for any loss or damage resulting from reliance on the information contained within this website including market news, analysis, trading signals ...
more


