
BTC/USD Forex Signal: Bitcoin Price Eyes A Strong Bearish Breakout
Bearish view
- Sell the BTC/USD pair and set a take-profit at 84,000.
- Add a stop-loss at 91,000.
- Timeline: 1-2 days.
Bullish view
- Buy the BTC/USD pair and set a take-profit at 91,000.
- Add a stop-loss at 84,000.
(Click on image to enlarge)
Bitcoin price remained in a tight range on Wednesday as investors continued to focus on the booming stock market and commodity prices. The BTC/USD pair was trading at 88,320, a few points above this week’s low of 86,200.
Bitcoin continued to consolidate as demand for the coin waned. One reason for this is that investors are focusing on the booming commodity market, with gold and silver prices soared to a record high. Data shows that demand for these assets has jumped, with their ETF inflows rising.
Spot Bitcoin ETF inflows have remained under pressure this month. They have lost over $111 million in assets this year after shedding over $1.09 billion in assets last month. Bitcoin ETFs have suffered outflows in the last three consecutive months.
The stock market has also continued booming this year, with the Dow Jones and the S&P 500 indices rising to a record high. ETF inflows in the stock market have also continued rising.
Bitcoin has pulled back as tensions in the United States continued rising. There are concerns about US tariffs, which will be applied to Canada and South Korean goods.
The next key catalyst will be the upcoming Federal Reserve interest rate decision. Economists polled by Reuters expect the bank to leave rates unchanged between 3.50% and 3.5%.
Recent macro data showed that the economy is doing well, with the economy expanding by 4.4% in the third quarter of last year.
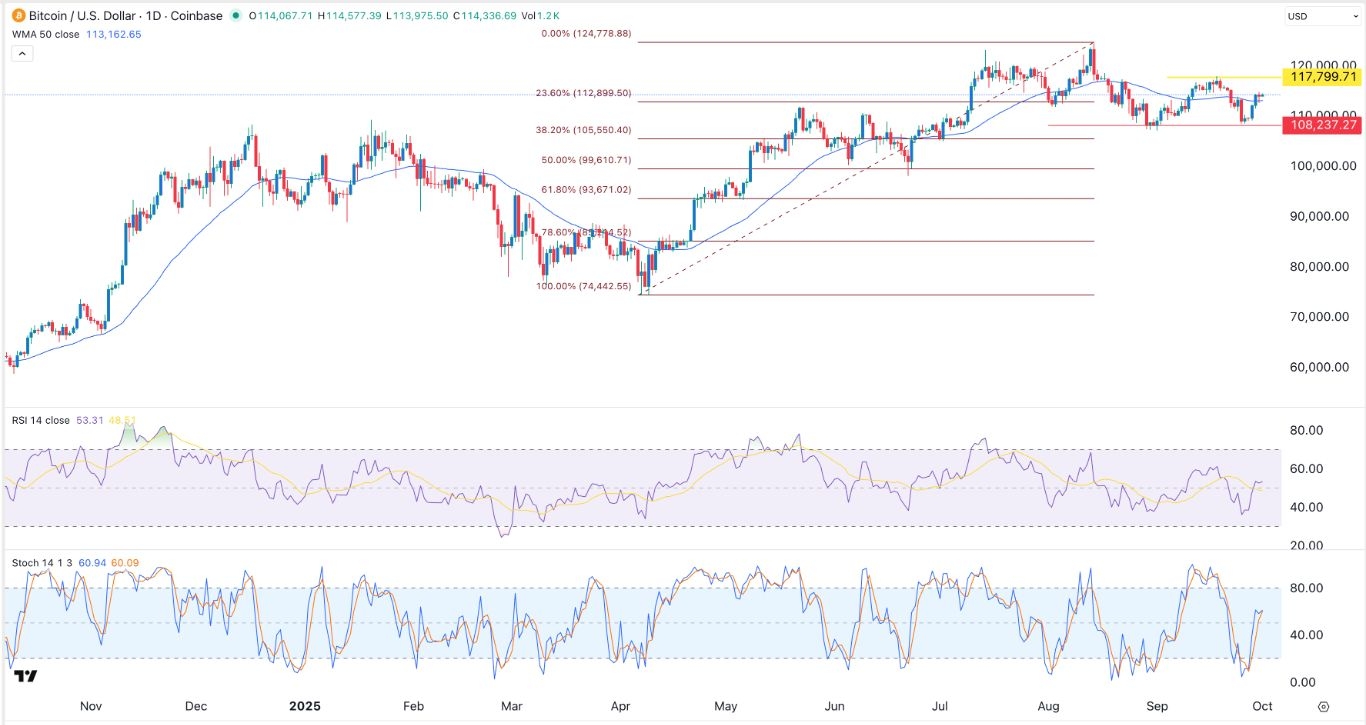
BTC/USD Technical Analysis
The daily chart shows that the BTC/USD pair has held steady in the past few days. It was trading at 88,400, a few points above this week’s low of 86,200.
The pair has moved to the ultimate support level of the Murrey Math Lines tool. It also moved below the 50-day Exponential Moving Average (EMA).
Bitcoin has formed a bearish flag pattern, which is made up of a vertical line and an ascending channel. The Relative Strength Index (RSI) has moved below the support at 50.
Therefore, the pair will likely continue falling as sellers target the key support level at 84,000. A move above the resistance at 91,000 will invalidate the bearish outlook.
More By This Author:
BTC/USD Forex Signal: Bearish Flag Points To A Drop AheadGBP/USD Forex Signal: Gains Momentum Amid Potential Fed And BoE Divergence
USD/CAD Forecast Ahead Of BoC And Fed Interest Rate Decisions
Risk Disclaimer: DailyForex will not be held liable for any loss or damage resulting from reliance on the information contained within this website including market news, analysis, trading signals ...
more

