BTC/USD Forex Signal: Bitcoin Price Could Retest $70k After Halving
Bullish view
- Buy the BTC/USD pair and set a take-profit at 70,000.
- Add a stop-loss at 64,000.
- Timeline: 1-2 days.
Bearish view
- Set a sell-stop at 65,000 and a take-profit at 63,000.
- Add a stop-loss at 69,000.
(Click on image to enlarge)
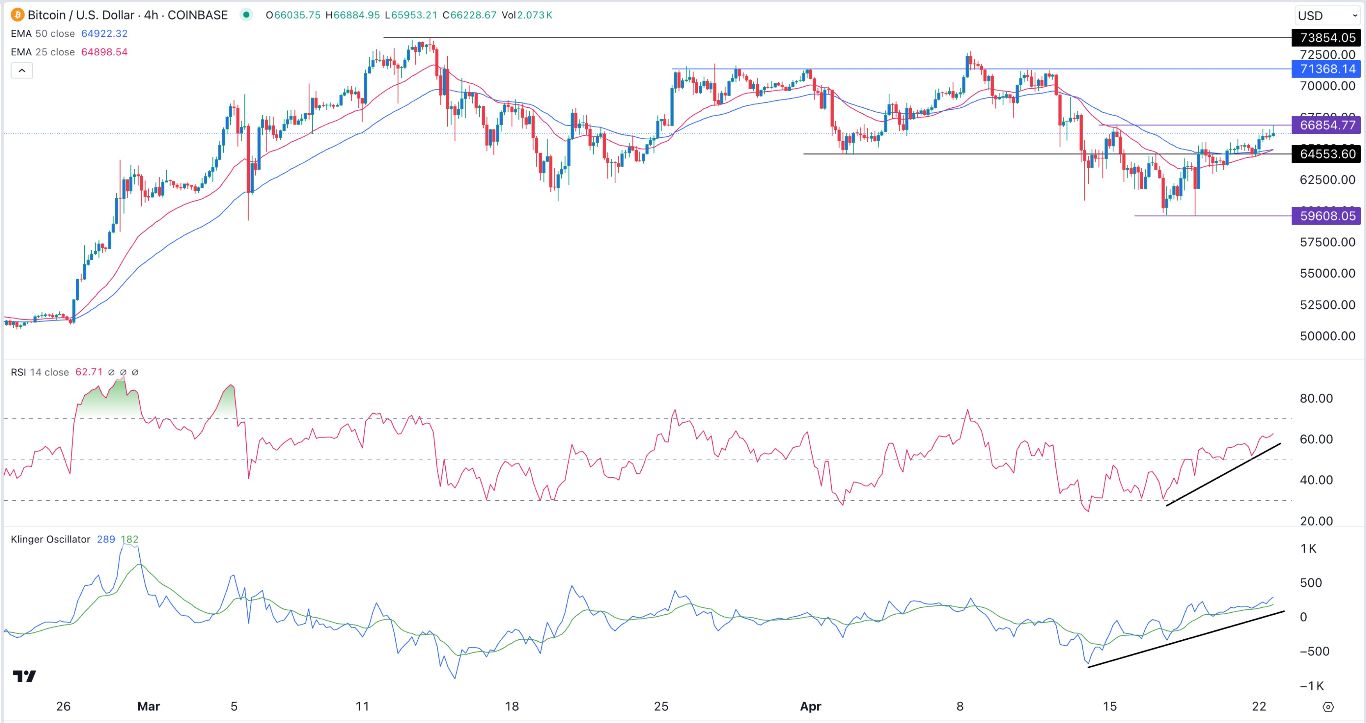
Bitcoin has staged a strong recovery in the past few days as investors cheered last Friday’s halving event. The BTC/USD pair jumped to a high of 66,855 on Tuesday morning, its highest swing since April 13th.
This recovery happened as a risk-on sentiment continued in the market. That is evidenced by the strong performance of American equities, with the Dow Jones, Nasdaq 100, and S&P 500 indices rising by over 1%.
Other global stocks also continued rising on Monday, with the FTSE 100 index soaring to a record high. Some of the other top indices like Italy’s FTSE MIB, DAX index, and CAC 40 continued rising as well.
Bitcoin also jumped as the market embraced the new normal of low Bitcoin production after the halving event. This halving came at a time when the supply of Bitcoin coins in exchanges has dropped to a multi-month low.
Looking ahead, the key macro events to watch will be Thursday’s US GDP and Friday’s Personal Consumption Expenditure (PCE) report. These numbers will be important because of their impact on the Federal Reserve.
Economists expect the data to show that US inflation held steady in March while the economy continued growing in Q1. If these numbers are strong, they will point to a more hawkish Federal Reserve. Most analysts expect the Federal Reserve will point to restrictive rates for longer.
BTC/USD technical analysis
The price of Bitcoin surged to a high of $73,855 earlier this year and then retreated to a low of $59,608 last week. This retreat happened as investors anticipated the halving event.
The pair has rebounded and is fast approaching the crucial resistance point at $67,000. It has moved above the important resistance point at $64,553, its lowest point on April 2nd.
The 25-period and 50-period Exponential Moving Averages (EMA) have formed a bullish crossover pattern, which is a positive sign. Meanwhile, the Relative Strength Index (RSI) has continued rising and has moved above the neutral point of 50.
The Relative Vigor Index (RVI) has also continued its uptrend, signaling that bulls are gaining momentum. Therefore, the outlook for the BTC/USD pair is bullish, with the next important point to watch being at 70,000. The stop-loss of this trade will be at 62,000.
More By This Author:
5 U.S. Penny Stocks To Buy Now For Short-Term GainsBTC/USD Forex Signal: Bitcoin Sits And Waits For Next Catalyst
SPCE Stock Price Analysis: Virgin Galactic Outlook Darkens
Disclosure: DailyForex will not be held liable for any loss or damage resulting from reliance on the information contained within this website including market news, analysis, trading signals ...
more


