BTC/USD Forex Signal: Bitcoin Pressured Despite ETF Inflows
Bearish view
- Sell the BTC/USD pair and set a take-profit at 107,300.
- Add a take-profit at 113,500.
- Timeline: 1-2 days.
Bullish view
- Buy the BTC/USD pair and set a take-profit at 113,500.
- Add a stop-loss at 107,300.
(Click on image to enlarge)
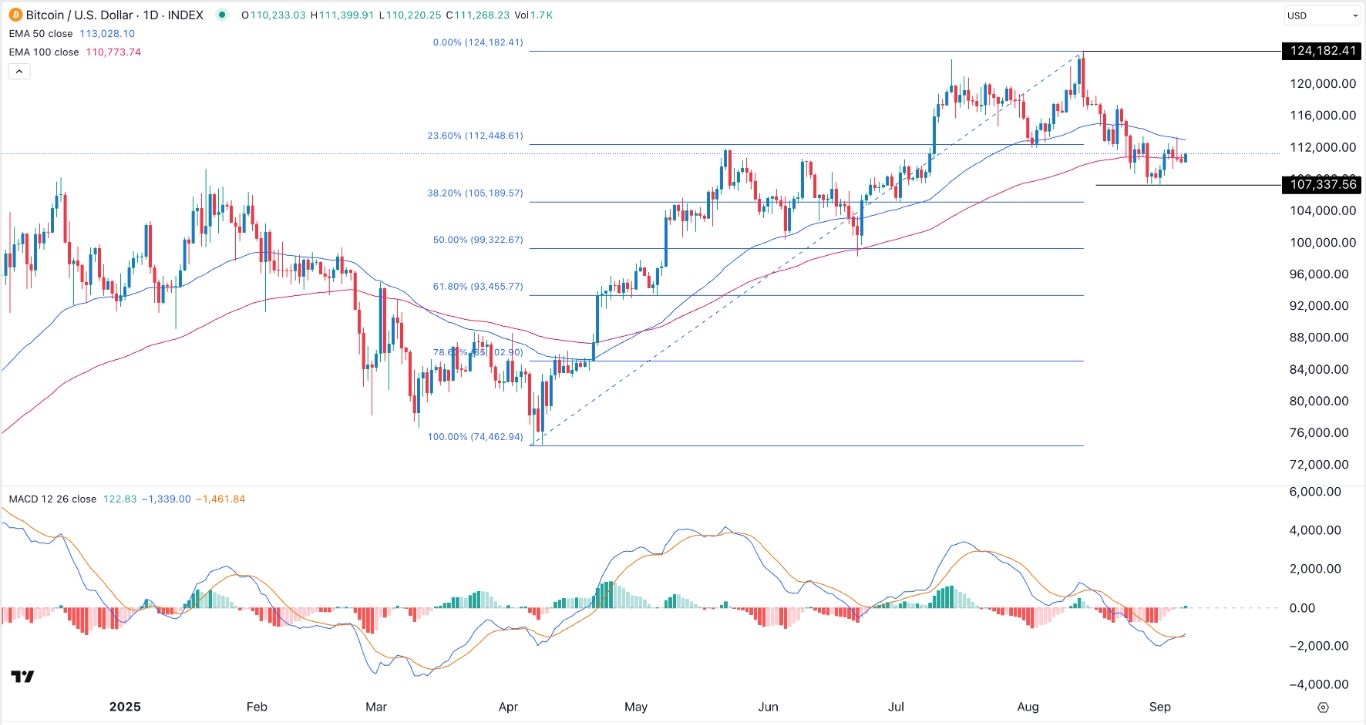
Bitcoin price was stuck at $111,200, a range it has been stuck at in the past few days. The BTC/USD pair is a few points above this month’s low of 107,337.
Bitcoin Price Rally Loses Momentum
The BTC/USD pair has remained inside a narrow range this month despite the ongoing demand from investors. Data shows that spot Bitcoin ETFs attracted over $246 million in assets last week after adding $440 million in the previous week.
These numbers have brought the total inflows since inception to over $54 billion. BlackRock’s IBIT ETF holds over $83 billion in assets, a significant portion of the $144 billion in assets. It is followed by other companies like Fidelity, Grayscale, and Ark Invest.
The BTC/USD pair has wavered, even as the US Dollar Index (DXY) has remained under pressure in the past few months. It dropped to $97.7, down from the year-to-date high of $110. Historically, the Bitcoin does well when the US dollar is falling.
One reason could be that investors are moving to gold, which has jumped above the important resistance level at $3,500, continuing a trend that has been going on for months. Investors seem to believe that gold is a better hedge against inflation.
The next important catalyst for the Bitcoin price will be the upcoming US consumer price and producer inflation numbers, which will provide more information about the economy. Economist expect the data to show that the headline inflation rose to 3.0% in August, continuing a trend that has been going on since Trump implemented his reciprocal tariffs.
Bitcoin price also reacted mildly to last Friday’s jobs numbers. In a report, the Bureau of Labor Statistics showed that the economy created just 22,000 jobs in August as the unemployment rate rose to 4.3%.
BTC/USD Technical Analysis
The daily timeframe chart shows that the BTC/USD pair remained in a tight range in the past few weeks as investors reacted to the US jobs data.
It was trading at 111,230, slightly above this week's low of 107,337. It has moved slightly below the 50-day Exponential Moving Average (EMA) and the 23.8% Fibonacci Retracement level at 112,448.
Therefore, the most likely scenario is where the BTC/USD pair remains under pressure this week as investors waited for the next major catalyst. The next point to watch will be at the 38.2%Fibonacci Retracement level at 105,190.
More By This Author:
USD/TRY Forecast Ahead Of The CBRT Decision, U.S. Inflation DataJEPI ETF Yields 7.9%: Is It A Good Dividend Fund For Retirement?
Lululemon Stock Crash: From A Shining Star To A Fallen Angel
Disclosure: Invezz is a place where people can find reliable, unbiased information about finance, trading, and investing – but we do not offer financial advice and users should always ...
more


