BTC/USD Forex Signal: Bitcoin Prepares For A Big Move Ahead
Bullish view
- Buy the BTC/USD pair and set a take-profit at 29,000.
- Add a stop-loss at 27,900.
- Timeline: 1 day.
Bearish view
- Set a sell-stop at 28,150 and a take-profit at 27,000.
- Add a stop-loss at 29,500.
Bitcoin price outperformed stocks on Wednesday as macro risks continued rising. The BTC/USD pair was trading at 28,287, much higher than this week’s low of 27,500. It remains a few points below the week-to-date high of 30,000.
Bitcoin ETF Hopes Rise
Bitcoin has done relatively well in the past few days as investors reacted to the ongoing hopes. On Monday, Bitcoin surged after a fake report said that the Securities and Exchange Commission (SEC) had approved Blackrock’s ETF.
It then retreated but remained at an elevated level after Blackrock denied the report. And on Wednesday, Fidelity, one of the biggest companies in the financial services industry, announced that it had modified its ETF application.
In the amendment, the company explained how it will safeguard user funds and prevent market manipulation. It also explained how it will explain the risks associated with the fund.
In addition to Fidelity and Blackrock, other companies like VanEck, Ark Invest, and Franklin Templeton have applied for spot ETFs. Analysts believe that an ETF will lead to more inflows from institutional investors.
Bitcoin ETF hopes explain why Bitcoin outperformed American equities. The Dow Jones, Nasdaq 100, and S&P 500 indices retreated by more than 1% as the price of crude oil surged. Brent jumped to $92 leading to elevated inflation fears.
As a result, the bond sell-off continued, with the 30-year Treasuries surging to 5.05%, the highest level since 2007. Mortgage rates also soared to 8%, putting more pressure on American consumers.
From a macro perspective, Bitcoin price will react to the upcoming statement by Jerome Powell, the Fed Chair. In it, he will likely provide more information about what to expect in the coming meeting. On Wednesday, Patrick Harker recommended that the bank should continue pausing.
BTC/USD technical analysis
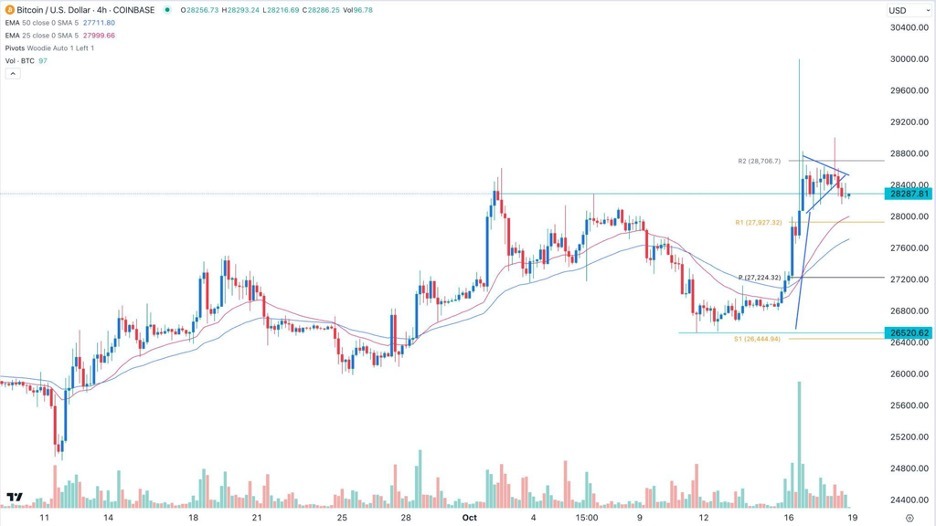
Bitcoin has done modestly well in the past few days. On the 4H chart, Bitcoin’s current price ($28,290) is at the highest point on October 5th. It has formed a bullish pennant pattern, which is a positive sign for the coin. Bitcoin is also above the 25-day moving average and the first resistance of the Woodie pivot point.
Bitcoin’s volume has also remained at an elevated level. Therefore, there is a likelihood that it will soon have a bullish breakout, with the next target being at 29,500.
(Click on image to enlarge)

More By This Author:
UK Inflation Unchanged at 6.7%, Core Inflation Eases to 6.1%
BTC/USD Forex Signal: Bullish Pennant Pattern Forms
Gold Technical Analysis: Gold Is Heading Towards Overbought Levels
Disclosure: DailyForex will not be held liable for any loss or damage resulting from reliance on the information contained within this website including market news, analysis, trading signals ...
more


