BTC/USD Forex Signal: Bitcoin Plunge Faces A Key Hurdle At $25,250
The BTC/USD pair also consolidated as a sense of fear spread in the market as crude oil prices jumped.
Bearish view
- Sell the BTC/USD pair and set a take-profit at 25,000.
- Add a stop-loss at 27,000.
- Timeline: 1-2 days.
Bullish view
- Set a buy-stop at 26,000 and a stop-loss at 25,000.
- Add a stop-loss at 24,500.
The BTC/USD pair was flat on Wednesday as a risk-off sentiment prevailed in the market. It was trading at 25,671, a few points below this week’s high of 26,120. Bitcoin has dropped by almost 10% from its highest point last week.
BTC consolidation continues
Bitcoin continued in a tight range even after some important news in the crypto industry. On Monday, London Stock Exchange (LSE) confirmed that it was working to incorporate blockchain in its operations. While the company did not provide more details, analysts believe that it intends to embrace tokenization.
Another important news came on Tuesday when Visa announced that it would expand its use of USD Coin using Solana’s technology. This was an important event because Visa is one of the biggest finance companies in the world.
These announcements mean that the idea of TradFi (traditional finance) is gaining traction. For example, traditional finance companies like Invesco, Fidelity, and Blackrock have all applied for a spot Bitcoin ETF. On Wednesday, Ark Finance filed for its Ethereum ETF.
The BTC/USD pair also consolidated as a sense of fear spread in the market as crude oil prices jumped. Brent has already jumped by more than 20% from its June low, meaning it has moved into a bull market.
The implication of the rising oil prices is that inflation will continue rising in the coming months. As a result, higher prices could trigger the Fed to maintain a hawkish tone in the next meetings.
These expectations explain why the US dollar index (DXY) has jumped to the highest level in five months and why American equities have retreated. The Dow Jones dropped by more than 100 points on Wednesday.
BTC/USD technical analysis
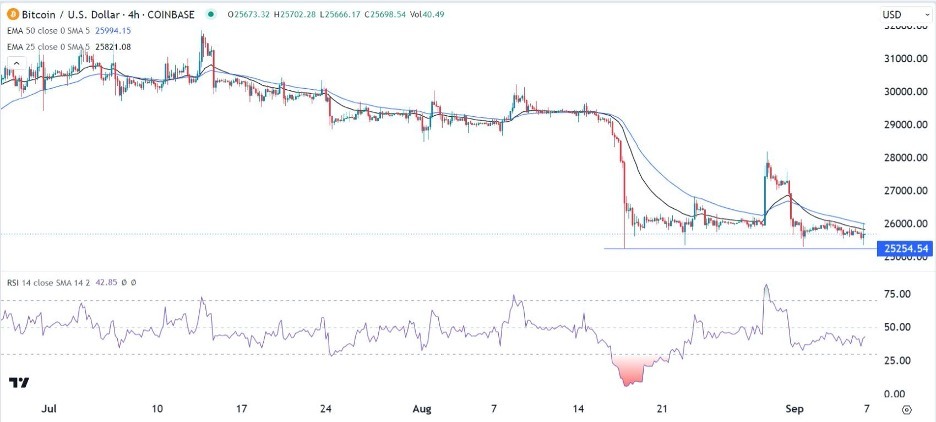
The four-hour chart shows that the BTC/USD pair found a strong support at 25,254 since August. It has failed to flip this support into a resistance four times recently. Bitcoin remains below the 25-period and 50-period moving averages (MA). Also, the Relative Strength Index (RSI) has moved slightly below the neutral point at 50.
Therefore, the outlook for the pair is neutral for now. More downside will be confirmed if bears manage to move below the support at 25,255. If this happens, the next level to watch will be 24,000.
(Click on image to enlarge)

More By This Author:
USD/TRY: Additional Moves Higher With A Calm Measured PaceBTC/USD Forex Signal: Bearish Consolidation Below $26,140
EUR/USD Technical Analysis: Upward Shift Is Strong
Disclosure: DailyForex will not be held liable for any loss or damage resulting from reliance on the information contained within this website including market news, analysis, trading signals ...
more


