BTC/USD Forex Signal: Bitcoin Path To $100k Is Intact
Bullish View
- Buy the BTC/USD pair and set a take-profit at 100,000.
- Add a stop-loss at 90,000.
- Timeline: 1-2 days.
Bearish View
- Set a sell-stop at 94,000 and a take-profit at 90,000.
- Add a stop-loss at 100,000.
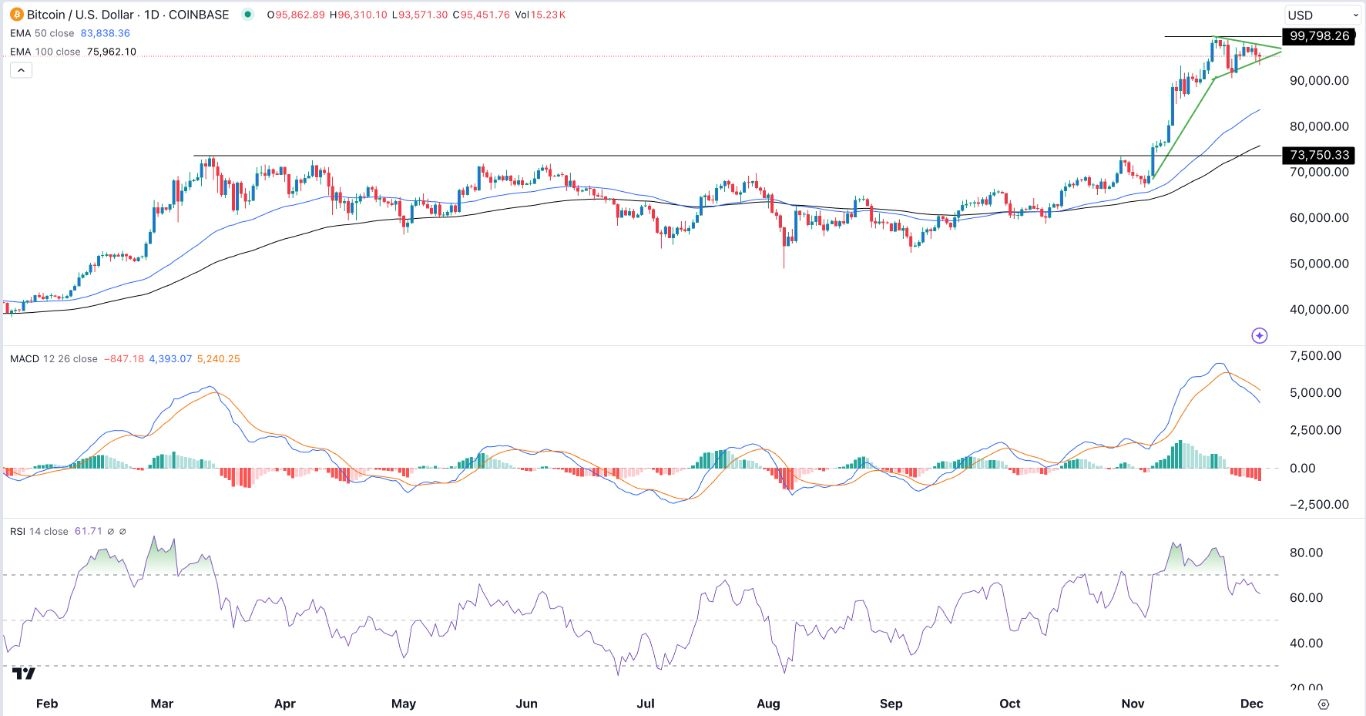
(Click on image to enlarge)
The BTC/USD exchange rate remained in a tight range as it struggled to move above the important resistance level at 100,000. Bitcoin was trading at 95,000, where it has been in the past few days.
Bitcoin’s consolidation happened as American stocks retreated slightly in the overnight session. The Dow Jones fell by 70 points, while the S&P 500 index retreated by 0.20%.
Bitcoin also retreated as the US dollar index remained on edge. The DXY index, which tracks the greenback against a basket of currencies, dropped to $106.2, from the year-to-date high of $108.05.
There are signs that Bitcoin is seeing strong demand. For example, data shows that spot Bitcoin ETFs added $353 million in assets, bringing the total amount of inflows to $31 billion. All these funds have over $103 billion assets.
Michael Saylor, the founder of MicroStrategy, insisted that more large companies will start adding Bitcoins into their balance sheets after seeing his company's success. MicroStrategy now holds 402,100 coins worth over $38 billion. Other companies that hold substantial amounts of Bitcoin are Marathon Digital, Tesla, Coinbase, and Block.
Bitcoin could also benefit by the actions of the Federal Reserve, which has committed to cutting interest rates as inflation moves to the 2% target level. While recent data has been sticky, analysts believe that the trend is friendly and that the coin will drop to 2% in the next few months.
Traders are still waiting for Donald Trump’s nomination to be the head of the Securities and Exchange Commission (SEC). Paul Atkins, a veteran regulator, has been mentioned, but some reporting suggests that he is not interested.
BTC/USD Technical Analysis
The daily chart shows that the BTC/USD pair has been in a tight range in the past few days as the trend to 100k stalled.
The pair has formed a bullish pennant pattern, which is a popular continuation sign. This pattern is characterized by a long vertical line and a small symmetrical triangle pattern.
Bitcoin has remained above the 50-day moving average, a sign that bulls are in control. However, the MACD and the Relative Strength Index (RSI) indicators have formed a bearish divergence pattern.
While the pair may move in either direction here, there are odds that it will make a strong bullish break out and possibly rise to 100,000.
More By This Author:
BTC/USD Forex Signal: Bullish Pennant Points To A Bullish BreakoutAUD/USD Forex Signal: Bearish Pennant, Death Cross Pattern Forms
Cheap DocuSign Stock Could Surge 125% To $175
Disclosure: DailyForex will not be held liable for any loss or damage resulting from reliance on the information contained within this website including market news, analysis, trading signals ...
more


