
Bearish view
- Sell the BTC/USD pair and set a take-profit at 80,000.
- Add a stop-loss at 91,000.
- Timeline: 1-2 days.
Bullish view
- Buy the BTC/USD pair and set a take-profit at 91,000.
- Add a stop-loss at 80,000.
(Click on image to enlarge)
Bitcoin price remained in a tight range on the final trading day of the year, capping a year in which it underperformed other assets like gold and the stock market. The BTC/USD pair was trading at 88,340, down by 30% from its highest level this year.
Bitcoin Price Faces Major Headwinds
The BTC/USD pair was flat as Bitcoin continued to face major headwinds. One of the most important challenges is that American investors continue to dump their ETFs, possibly as they move to other better-performing assets like stocks and commodities.
Data compiled by SoSoValue shows that Bitcoin ETFs have had two consecutive days of outflows. They shed over $1 billion in assets this month, down from $3.4 billion from the previous month. These funds have now shed billions of dollars in assets, bringing the cumulative inflow to $56 billion.
Bitcoin price continued to consolidate as investors deleveraged, with the futures open interest falling to a multi-month low of $58 billion. The open interest remained under pressure after the significant liquidation event that happened on October 10 this year. The event has pushed the Crypto Fear and Greed Index to the fear zone.
Bitcoin price reacted mildly to the latest Federal Reserve minutes, which provided more information about the last meeting. This report showed that officials deliberated on the state of the economy, especially on inflation, which has remained above the 2% target for over four years.
The reaction was mild because recent data showed that inflation dropped in November, while the economy expanded at a faster pace than expected in the third quarter of this year.
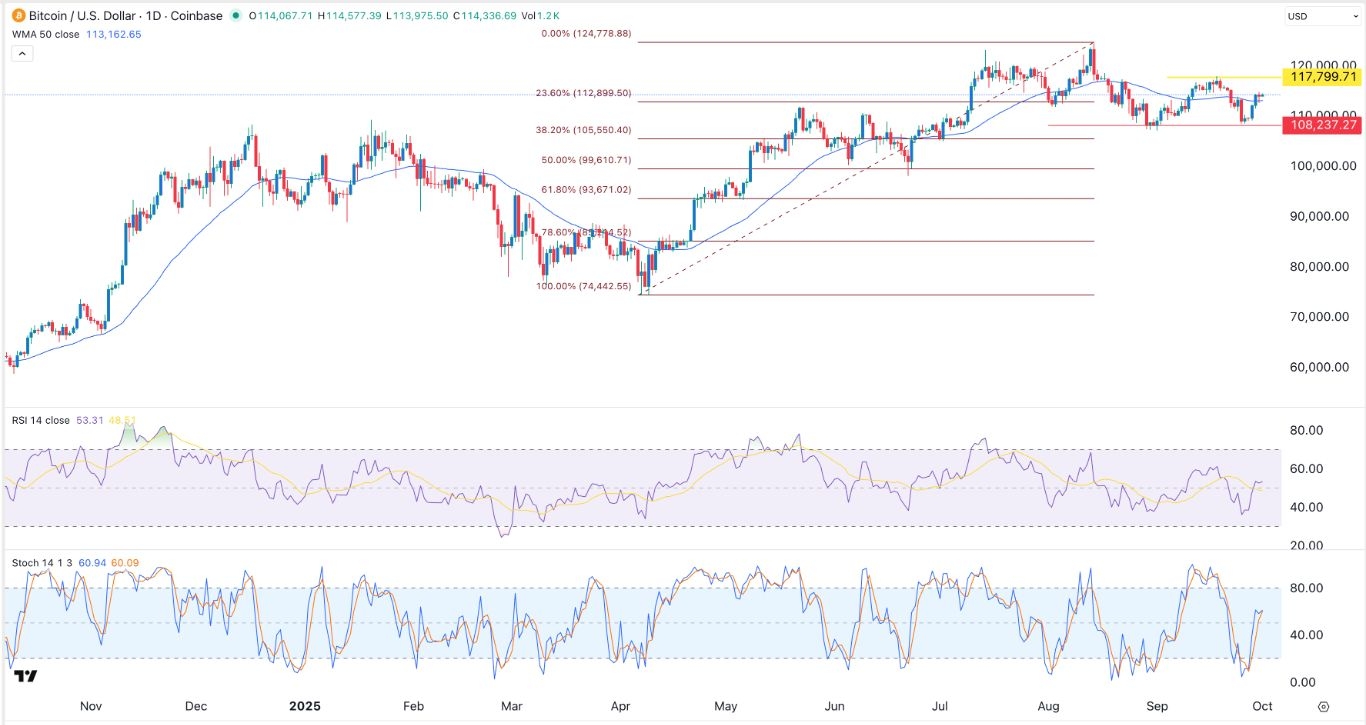
BTC/USD Technical Analysis
The eight-hour timeframe chart shows that the BTC/USD pair has moved sideways in the past few weeks. It has remained inside the key support level at 84,685 and the resistance level at 90,488 since December 14.
As a result, the MACD indicator has remained at the zero line, while the Average Directional Index is below 20, a sign that the volatility has continued.
The pair remains below the Supertrend indicator and is consolidating at the 50-period moving average.
Therefore, the most likely BTC/USD forecast is neutral with a bearish bias as it has formed a bearish pennant pattern. A breakdown will likely retest the key support level at 80,000. On the other hand, a move above the resistance at 90,488 will invalidate the bearish outlook.
More By This Author:
BTC/USD Forex Signal - Bearish Pennant Pattern Points To More DownsideBTC/USD Forex Signal: Bitcoin Forms A Bearish Pennant Pattern
UNI Price Prediction As Uniswap Burns 100 Million Tokens


Comments
Log in or sign up to join the conversation.