BTC/USD Forex Signal: Bitcoin Loses Momentum Despite Fed Rate Cut
Bearish view
- Sell the BTC/USD pair and set a take-profit at 108,000.
- Add a stop-loss at 113,000.
- Timeline: 1-2 days.
Bullish view
- Buy the BTC/USD pair and set a take-profit at 113,000.
- Add a stop-loss at 108,000.
(Click on image to enlarge)

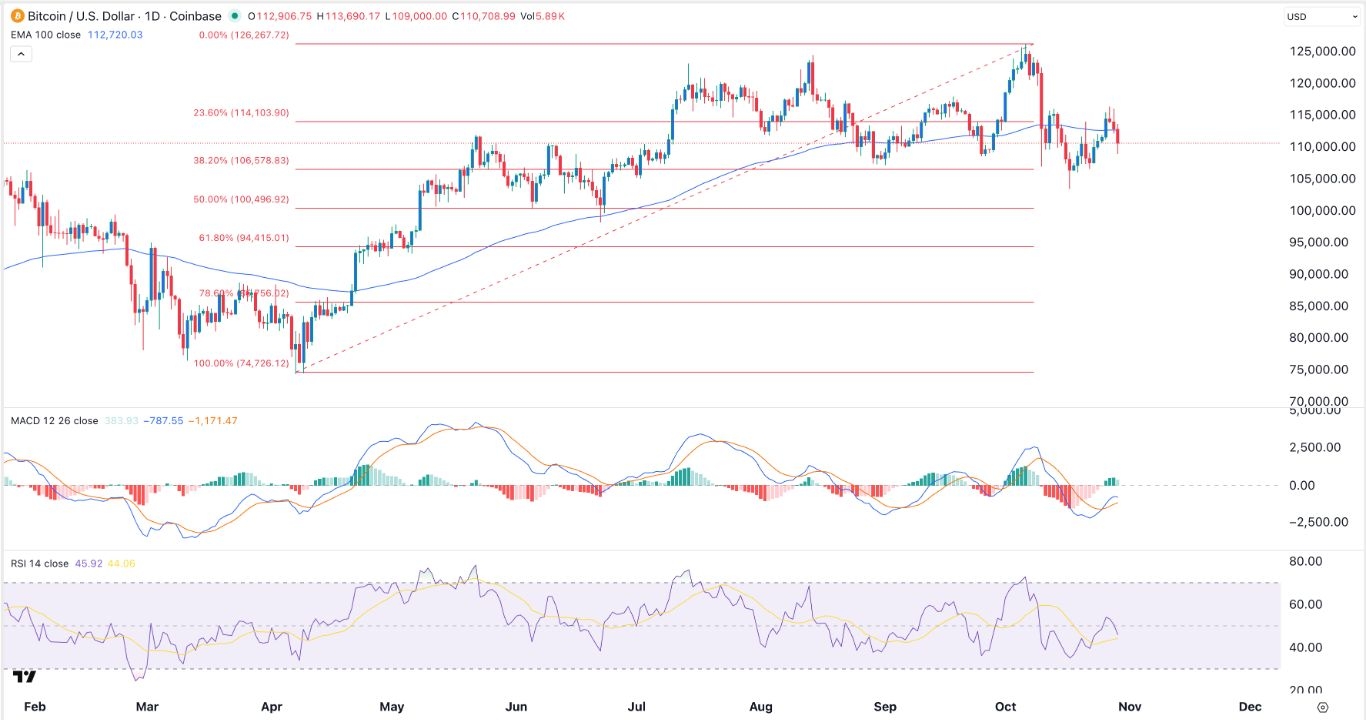
The BTC/USD pair continued its downtrend even after the Federal Reserve slashed interest for the second consecutive meeting. It dropped to a low of 108,945, down from this week's high of 116,580.
Bitcoin price dropped despite some major developments. The first major one was that the Federal Reserve completed its two-day meeting and decided to slash interest rates by 0.25%. Officials also decided to end the quantitative tightening process in December.
Bitcoin dropped after the latest Fed decision as investors sold the news because it was in line with expectations. Also, Jerome Powell hinted that the bank may not cut again in December as most analysts were expecting.
The BTC/USD pair retreated even as American investors continued buying Bitcoin through ETFs. Bitcoin ETF inflows have continued this week, bringing the cumulative total to over $64 bullish.
These funds now hold Bitcoin tokens worth over $154 billion, with BlackRock’s IBIT having over $92 billion in assets.
The next important catalyst for the Bitcoin price is the upcoming meeting between Donald Trump and Xi Jinping at the APEC Summit in South Korea, where the two leaders will talk on trade and other things.
Analysts hope that the two sides will reach a deal that reduces tensions between the two sides. One way that this is happening is China has started buying American soybeans, delivering a major political victory to Donald Trump.
Still, the BTC price may drop even as the two sides makes a deal because it has already been priced in by market participants.
BTC/USD Technical Analysis
The daily timeframe chart shows that the BTC/USD pair retreated for three consecutive days and is now hovering at its lowest level in days. It has moved below the 100-day Exponential Moving Average (EMA) and the Ichimoku cloud indicator.
The pair has also dropped below the 23.6% Fibonacci Retracement level at 114,103, a sign that bears are in control for now. Top oscillators like the Relative Strength Index and the MACD have also pointed downwards.
Therefore, the pair will likely continue falling, potentially to the next key support level at 106,600, the 38.2% Fibonacci Retracement level. A move above the resistance at 116,228 will invalidate the bearish outlook.
More By This Author:
Lucid Stock Price Forms Risky Pattern Pointing To A Steeper CrashGBP/USD Forex Signal: Supertrend Points To A Crash Ahead Of FOMC
BTC/USD Forex Signal: Loses Momentum As Megaphone Forms
Risk Disclaimer: DailyForex will not be held liable for any loss or damage resulting from reliance on the information contained within this website including market news, analysis, trading signals ...
more


