BTC/USD Forex Signal: Bitcoin Is Still Stuck In A Tight Range
The BTC/USD pair has been in a bearish trend in the past few weeks.
Bearish view
- Sell the BTC/USD pair and set a take-profit at 28,000.
- Add a stop-loss at 30,100.
- Timeline: 1-2 days.
Bullish view
- Set a buy-stop at 29,400 and a take-profit at 30,500.
- Add a stop-loss at 28,000.
Bitcoin price continued wavering as open interest, volume, and volatility declined. The BTC/USD pair was hovering at 29,000, where it has been in the past few months. It has remained in this range since June as investors wait for the next catalyst.
Bitcoin’s open interest slips
The BTC/USD pair continued consolidating as the US dollar index (DXY) continued rising. After falling to a low of $99.60 in July, the US dollar index rose to $102.72. In the past, Bitcoin tends to have an inverse relationship with the dollar.
The US dollar rally continued rising as investors reacted to the US credit rating downgrade by Fitch. In its statement, Fitch warned that the US was struggling as the country’s debt burden surged. As a result, American indices like the S&P 500 and Nasdaq 100 indices plunged by more than 1%.
Meanwhile, on-chain data showed that Bitcoin’s metrics are deteriorating. For example, the volume of Bitcoin traded in exchanges has dropped sharply in the past few weeks. At the same time, open interest in the futures market has moved sideways. Data by CoinGlass shows that open interest in exchanges like Binance, Bitmex, and Bybit dropped to $13.4 billion.
Its interest peaked at over $14.5 billion in July after the Ripple vs Securities and Exchange Commission (SEC) case. A falling open interest is a sign that demand is diminishing in the industry.
Looking ahead, the next key data that could move the BTC/USD pair will be the upcoming US non-farm payrolls (NFP) data. Economists expect the data to show that the economy added over 180k jobs in July as the unemployment rate remained at 3.6%.
BTC/USD technical analysis
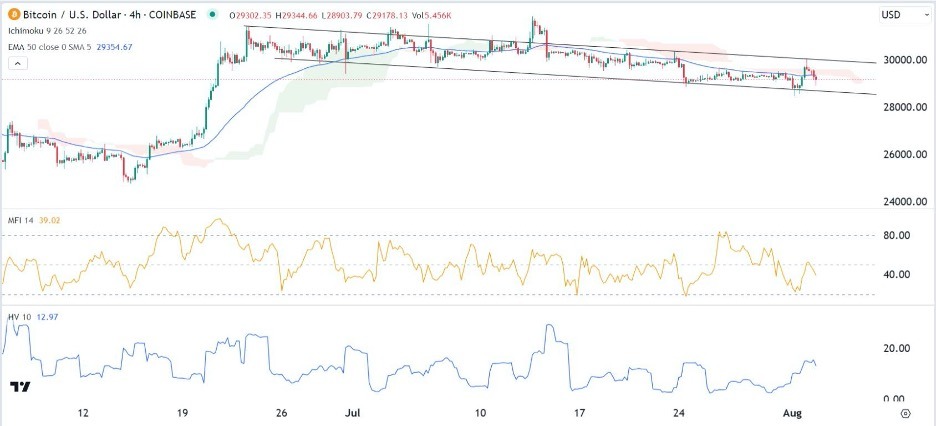
The BTC/USD pair has been in a bearish trend in the past few weeks. On the 4H chart, the pair has formed a descending channel shown in black. It is now at the middle point of this channel. Also, the pair is consolidating at the 25-period and 50-period moving averages.
The Money Flow Index (MFI) has moved slightly below the middle line while the historical volatility indicator has drifted upwards. Therefore, the pair will likely remain in this range for a while. In this case, the key support and resistance levels to watch will be at 28,500 and 30,000.
(Click on image to enlarge)

More By This Author:
Gold Technical Analysis: Technical Indicators Are Heading Towards Oversold LevelsBTC/USD Forex Signal: Bullish Breakout Or New Bearish Price Channel?
EUR/USD Forex Signal: Euro is Extremely Bearish Below 1.0940
Disclosure: DailyForex will not be held liable for any loss or damage resulting from reliance on the information contained within this website including market news, analysis, trading signals ...
more


