BTC/USD Forex Signal: Bitcoin Is Extremely Bullish Above 68,453
Bullish view
- Buy the BTC/USD pair and set a take-profit at 70,000.
- Add a stop-loss at 64,000.
- Timeline: 1-2 days.
Bearish view
- Set a sell-stop at 65,000 and a take-profit at 63,000.
- Add a stop-loss at 68,000.
(Click on image to enlarge)
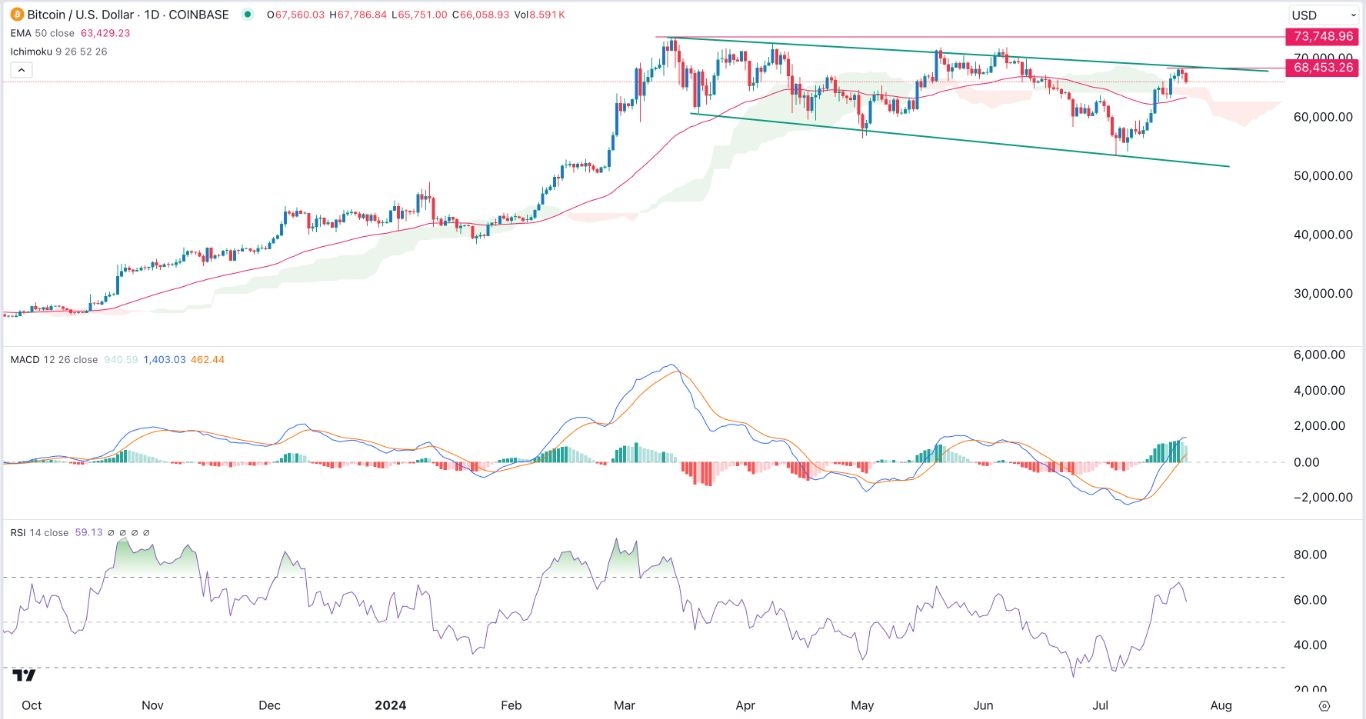
The BTC/USD pair retreated slightly this week even as the crypto market received some important good news. Bitcoin fell to $65,865 on Wednesday, a few points below this week’s high of $68,453.
Bitcoin ETF inflows continue
The BTC/USD pair retreated as data pointed to more inflows in spot Bitcoin ETFs. The iShares Bitcoin Trust (IBIT) received $527 million in assets on Monday, its highest increase since March. Other funds by companies like Franklin Templeton, Invesco, and Fidelity have had inflows this month.
Meanwhile, signs of improvements in regulations continued after the Securities and Exchange Commission (SEC) gave its approval of spot Ethereum ETFs. Funds by companies like Blackrock, Invesco, and Fidelity started trading on Tuesday, attracting over $400 million in inflows.
This approval was important because the SEC has previously hinted that it would not approve these funds because it sees Ether as an unregulated security. To avoid this claim, the issuers removed the staking feature in their funds, a move that could affect their inflows.
The other positive news came from the United States where economic data revealed that existing home sales dropped to 3.89 million in July from 4.11 million in June. The 5.4% dip was higher than expected, raising the possibility that the Fed will start cutting interest rates soon. Risky assets do well when the Fed has embraced a dovish tone.
BTC/USD technical analysis
Bitcoin has been in a steady recovery in the past few days, reaching a high of $68,453 on Monday. This was an important resistance since it coincided with the descending trendline that connects the highest swings since March 13th. It was also the upper side of the falling broadening wedge pattern, a popular bullish sign.
The BTC/USD pair has remained above the 50-day moving average while the histogram of the MACD has moved above zero. It has also remained above the Ichimoku cloud indicator.
Therefore, Bitcoin will likely remain under pressure on Tuesday as investors wait for the next potential catalyst. A bullish move above the upper side of the wedge pattern at 68,453 will point to more upside, with traders focusing on the resistance at 70,000.
More By This Author:
BTC/USD Forex Signal: Falling Broadening Wedge Points To More UpsideEUR/USD Forex Signal: Cup And Handle Points To A Rebound
EUR/USD Weekly Forecast: Inverse H&S Pattern Points To A Rebound
Disclosure: DailyForex will not be held liable for any loss or damage resulting from reliance on the information contained within this website including market news, analysis, trading signals ...
more


