BTC/USD Forex Signal: Bitcoin Has Upside Amid A Risk-On Sentiment
Bullish view
- Buy the BTC/USD pair and set a take-profit at 68,630.
- Add a stop-loss at 64,630.
- Timeline: 1-2 days.
Bearish view
- Set a sell-stop at 66,000 and a take-profit at 64,000.
- Add a stop-loss at 68,630.
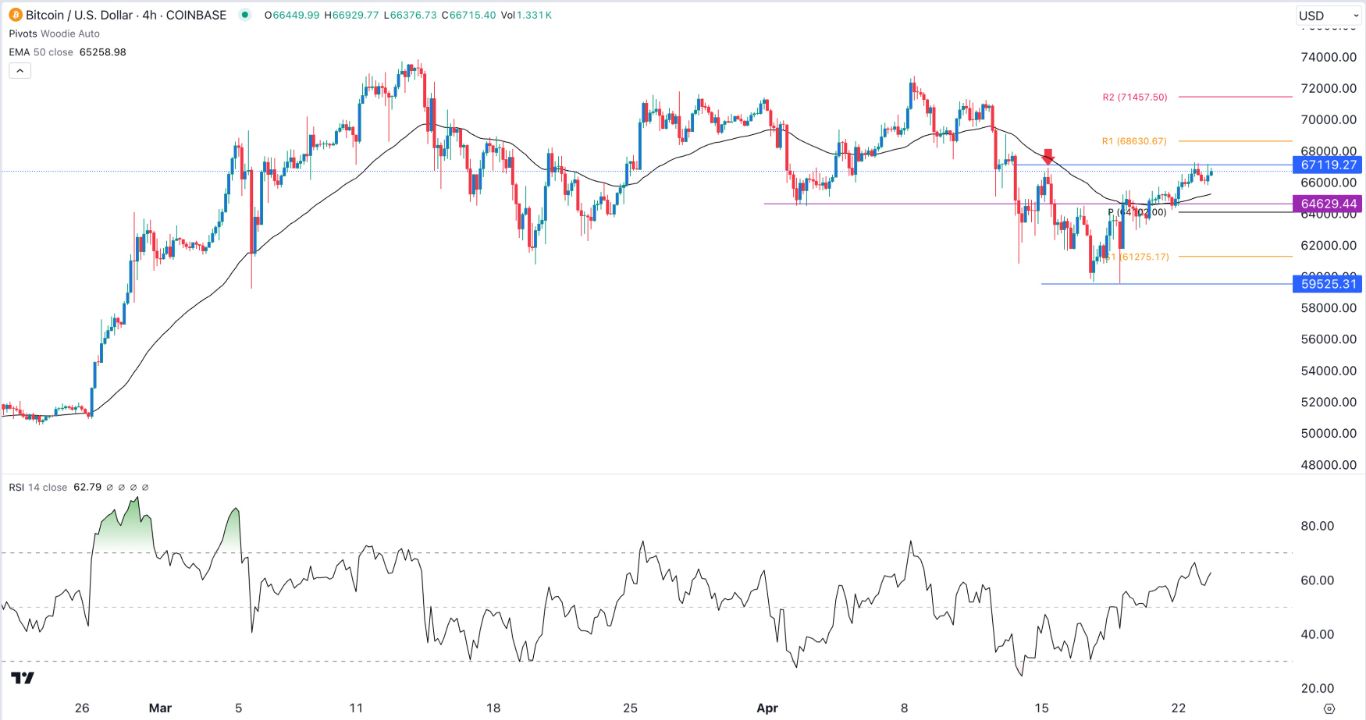
(Click on image to enlarge)
Bitcoin price remained in a tight range on Wednesday morning even as the risk-on sentiment continued. The BTC/USD pair rose to the crucial resistance point at 67,120 on Wednesday, much higher than this month’s low of 59,525.
Risk-on sentiment
Traders have embraced a risk-on sentiment this week as the recent geopolitical risks continued fading. The evidence of this performance is the performance of the stock, forex, and commodities market.
Global stocks have bounced back this week, with the Dow Jones and Nasdaq 100 indices rising for two straight days. The US dollar index, often seen as a safe haven, has dropped to $105.1, down from last week’s high of $106.25.
Meanwhile, most commodity prices have pulled back, with the price of Brent moving to $87 and WTI falling to $83. Gold price also pulled back sharply from its highest point this month.
Bitcoin price tends to do well in a period when the market has embraced a risk-on sentiment, which explains why it has bounced back to over $67,000. Other cryptocurrencies like Solana, Avalanche, and Ripple have also bounced back.
Bitcoin has also rallied as signs emerge that most of its spot ETFs are seeing inflows albeit at a slower pace than in March. The iShares Bitcoin ETF’s net assets have jumped to over $18.1 billion while the Fidelity Wise Origin ETF has over $10.7 billion in assets.
There is a likelihood that these funds will see more inflows in the coming months as demand continue rising after the latest Bitcoin halving.
This halving slashed the amount of Bitcoin rewards, which hiked the mining difficulty and slowed its supply. It is also happening at a time when the supply of Bitcoin in exchanges has continued falling in the past few months.
BTC/USD technical analysis
Turning to the daily chart, we see that the BTC/USD pair has staged a strong comeback from its lowest level this month. It has rebounded to the crucial resistance at 67,119, which was its highest swing on April 15th. The pair has also risen above the 50-period Exponential Moving Average (EMA).
It also sits comfortably above the key support at 64,630, its lowest swing on April 2nd. The Relative Strength Index (RSI) has continued rising and is nearing the overbought point of 70. Therefore, the pair will likely continue rising as buyers target the first resistance point of the Woodie pivot point at 68,630.
More By This Author:
GBP/USD Forex Signal: Pound Sterling’s Comeback Set To Be BriefCorporate Bond ETFs HYG And JNK Suffer Outflows Amid Fed Jitters
BTC/USD Forex Signal: Bitcoin Price Could Retest $70k After Halving
Disclosure: DailyForex will not be held liable for any loss or damage resulting from reliance on the information contained within this website including market news, analysis, trading signals ...
more


