BTC/USD Forex Signal: Bitcoin Gains To Be Short-Lived
High inflation is usually bearish for Bitcoin and other cryptocurrencies.
Bearish view
- Sell the BTC/USD pair and set a take-profit at 25,200.
- Add a stop-loss at 27,200.
- Timeline: 1-2 days.
Bullish view
- Set a buy-stop at 26,500 and a take-profit at 28,000.
- Add a stop-loss at 25,000.
Bitcoin and other cryptocurrencies drifted upward even as risks for more interest rate hikes by the Federal Reserve rose. The BTC/USD pair rose slightly above the key resistance level of 26,000, higher than this week’s low of 24,940.
US dollar index (DXY) rally eases
The BTC/USD pair held quite well as the US dollar index (DXY) retreated to $104.23, a few points below this month’s high of $105.5. The dollar eased even after the latest US consumer inflation data.
According to the Bureau of Labor Statistics (BLS), the headline Consumer Price Index (CPI) rose from 0.2% to 0.6%. This increase was higher than the median estimate of 0.4%. As a result, this inflation rose to 3.6%, the highest level in months.
Further, the closely watched core consumer inflation dropped from 4.7% in July to 4.3%, the lowest level since 2021. There is a likelihood that inflation will continue rising now that the price of crude oil has soared to the highest level this year.
High inflation is usually bearish for Bitcoin and other cryptocurrencies. For one, it pushes the Federal Reserve to hike interest rates. Higher rates leads to better returns from safe assets like money market funds. These funds are now yielding more than 5%, the highest level in years.
Bitcoin price has also stabilised as investors react to the decision by Franklin Templeton to file for a Bitcoin ETF. It now joins other Wall Street companies like Invesco and Fidelity, which have filed for these funds. Therefore, investors believe that the SEC will approve one or more of these funds.
BTC/USD technical analysis
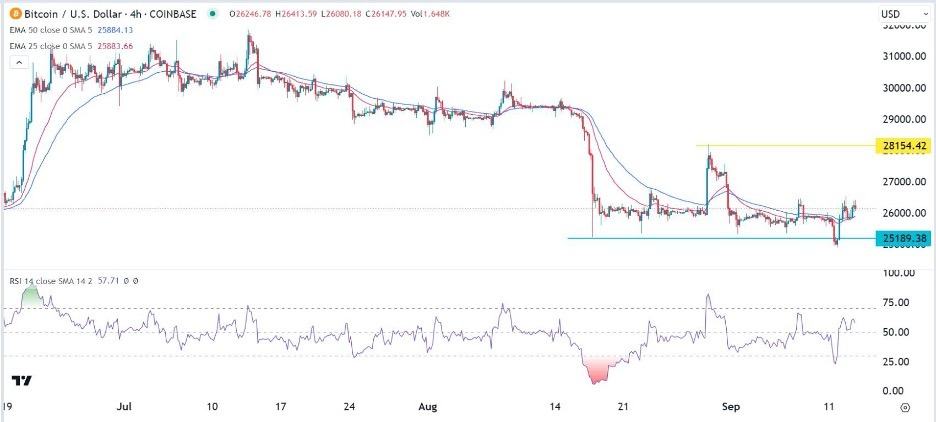
The 4H chart shows that the BTC/USD pair has been in a tight range in the past few days. It has risen above this week’s low of 24,940 to over 26,000. The pair has moved slightly above the 25-period and 50-period moving averages while the Relative Strength Index (RSI) has moved to the neutral point of 50.
Bitcoin price has also formed a head and shoulders pattern whose head is at 28,154, the highest point on August 29th. Therefore, the BTC/USD pair will likely remain in this range and then retest the key support at 25,190.
(Click on image to enlarge)

More By This Author:
US Inflation Rate Rises To 3.7%, Core Inflation Falls To 4.3%
BTC/USD Forex Signal - Consolidation Continues
GBP/USD Technical Analysis: Bears’ Control Gets Stronger
Disclosure: DailyForex will not be held liable for any loss or damage resulting from reliance on the information contained within this website including market news, analysis, trading signals ...
more


