BTC/USD Forex Signal: Bitcoin Forms A Double Bottom At 40,580
The BTC/USD pair remained in a tight range as in the past few days as some investors take profits and as concerns about the Fed continued.
Bullish view
- Buy the BTC/USD pair and set a take-profit at 43,180.
- Add a stop-loss at 40,000.
- Timeline: 1-2 days.
Bearish view
- Sell the BTC/USD pair and set a take-profit at 40,000.
- Add a stop-loss at 43,000.
Bitcoin price continued consolidating this week as the recent momentum faded. After peaking at near $45,000 on December 8, Bitcoin has remained at $41,000. The BTC/USD pair has dropped by more than 7% from its highest point this year.
Bitcoin rally loses steam
The BTC/USD pair remained in a tight range as in the past few days as some investors take profits and as concerns about the Fed continued. While the Fed delivered a dovish tone, there are concerns that the Fed could delay rate hikes.
This view was supported by several Fed officials who see no need to cut rates in the first quarter of 2024. Besides, inflation remains significantly above the Federal Reserve’s target of 2.0% while the economy is doing well.
The most recent data showed that core inflation, which excludes the volatile food and energy prices, remained at 4.0% in November. At the same time, the economy expanded by 5.2% in the third-quarter. The closely-watched Atlanta Fed GDP Now estimates that the economy will grow by 2.6% in Q4.
Additional data showed that the economy is doing well as the unemployment rate dropped to 3.2%. Retail sales, manufacturing, and services output have been relatively steady in the past few months. Therefore, cutting rates would risk fueling inflation.
The BTC/USD pair’s consolidation has coincided with the recent rebound of the US dollar. The dollar index, which tracks the performance of the greenback against a basket of currencies, has rebounded to $102.5, up from last week’s low of $101.75.
BTC/USD technical analysis
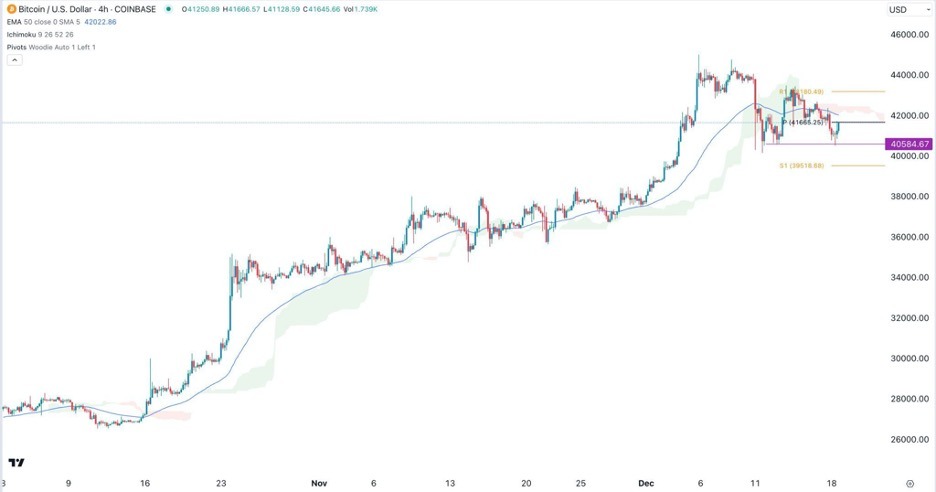
Bitcoin price went through a shakeout last week as it crashed from over $44,000 to a low of 40,120. A shakeout happens when an asset drops sharply for no main reason. It has now remained below the key support level at 42,000, which is below the 50-period Exponential Moving Average (EMA).
Bitcoin has also moved below the Ichimoku cloud. Also, the pair has retested the Woodie pivot point. Fortunately, it has formed a small double-bottom pattern at 40,585 whose neckline is at 43,245, which is also along the first resistance of the Woodie pivot point.
Therefore, the outlook for Bitcoin is bullish as long as it is above the double-bottom pattern at 40,585. If this happens, the next price to watch will be at 43,245.
(Click on image to enlarge)

More By This Author:
EUR/USD Analysis: Euro Gives Up Its GainsForex Today: Markets Await Bank Of Japan Policy Clarification
BTC/USD Forex Signal: Dominant Bearish Trend Line
Disclosure: DailyForex will not be held liable for any loss or damage resulting from reliance on the information contained within this website including market news, analysis, trading signals ...
more


