BTC/USD Forex Signal: Bitcoin Forecast After Surging To A Record High
Bullish View
- Buy the BTC/USD pair and set a take-profit at 83,000.
- Add a stop-loss at 77,000.
- Timeline: 1-2 days.
Bearish View
- Set a sell-stop at 78,000 and a take-profit at 76,000.
- Add a stop-loss at 83,000.
(Click on image to enlarge)
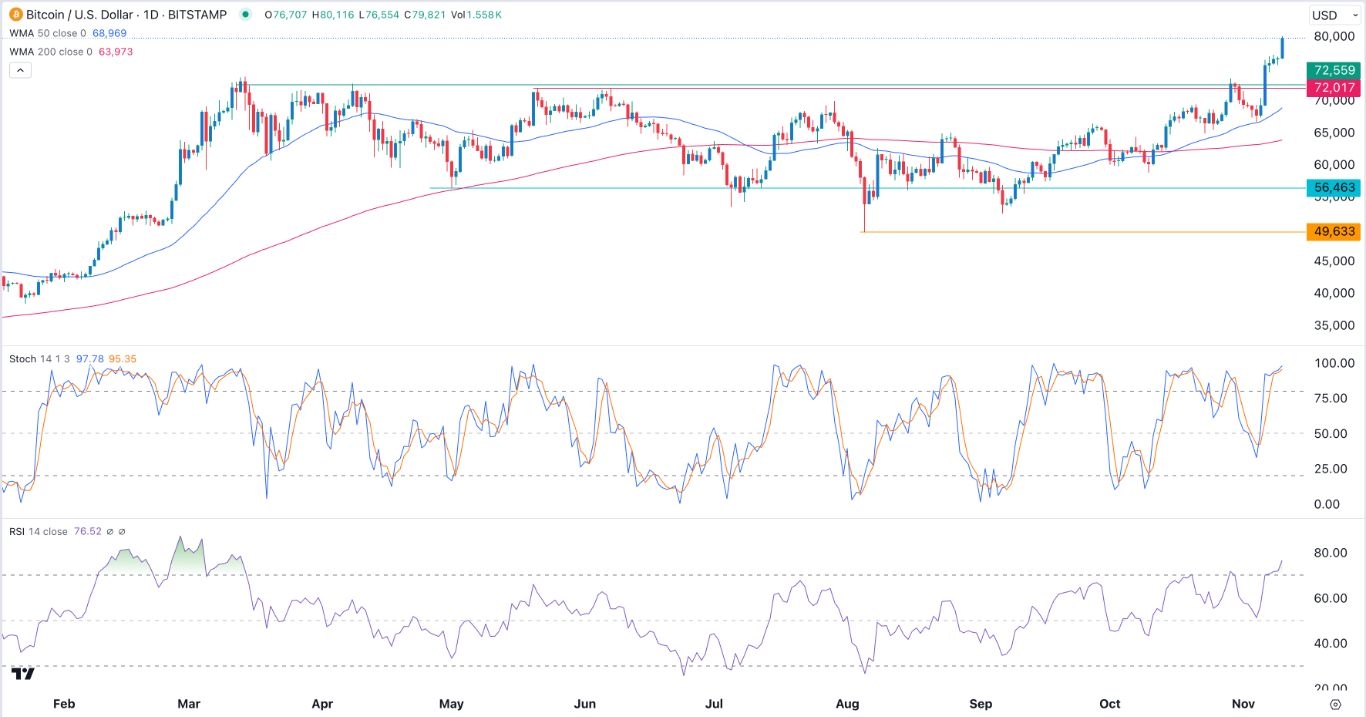
The BTC/USD pair continued surging, reaching its all-time high, as investors cheered the recent Trump election and Federal Reserve interest rate cut. Bitcoin also soared after the US elected the most crypto-friendly legislators ever. It was trading at 80,000 on Monday morning, much higher than the August low of 49,800.
Catalysts for Bitcoin
Bitcoin price has surged as investors cheer several catalysts. First, November is, historically, the best-performing month for Bitcoin and other cryptocurrencies.
Second, Donald Trump won the US election last week, meaning that the industry could have positive legislation measures in the coming months. Trump is a major stakeholder in the crypto industry. Data shows that he has a crypto portfolio of over $6 million. He is also running a token sale for the World Liberty Financial crypto project.
Third, the Federal Reserve delivered its second interest rate cut of the year last week. It slashed interest rates by 0.25% after it cut rates by 0.50% in the previous meeting. Analysts believe that the bank has more room to cut rates in the next meetings.
Historically, cryptocurrencies like Bitcoin and Ethereum do well when the Fed is cutting interest rates. In that period, investors often move from low-risk money market funds to risky assets like Bitcoin.
Looking ahead, the key catalyst for Bitcoin will be the upcoming US consumer price index (CPI) data scheduled on Wednesday. Economists believe that inflation continued falling, with the headline CPI falling to 2.2% in October.
BTC/USD Technical Analysis
The daily chart shows that Bitcoin has been in a strong bull run in the past few months. It formed a golden cross pattern as the 50-day and 200-day Weighted Moving Averages (WMA) crossed each other.
Bitcoin has now moved above the key resistance level at $72,600, the neckline of the inverse head and shoulders pattern. In most periods, this is one of the most bullish signs in the market.
The BTC/USD pair has moved to the upper side of the Bollinger Bands, while the Relative Strength Index (RSI) and Stochastic Oscillators have all pointed upwards. Therefore, the BTC/USD pair will likely keep rising as bulls target the key resistance point at 83,000. This view will become invalid when the Bitcoin price retreats below the key support at 77,000.
More By This Author:
Chegg Stock Price Outlook: Could CHGG Surge 75% After Earnings?Crypto Price Predictions: X Empire, Vantard, Dogecoin
BTC/USD Forex Signal: Bitcoin Price Rally is Just Getting Started
Disclosure: DailyForex will not be held liable for any loss or damage resulting from reliance on the information contained within this website including market news, analysis, trading signals ...
more


