BTC/USD Forex Signal: Bitcoin Double-Top Points To More Downside
Bearish view
- Sell the BTC/USD pair and set a take-profit at 100,450.
- Add a stop-loss at 110,000.
- Timeline: 1-2 days.
Bullish view
- Buy the BTC/USD pair and set a take-profit at 110,000.
- Add a stop-loss at 100,450.
(Click on image to enlarge)
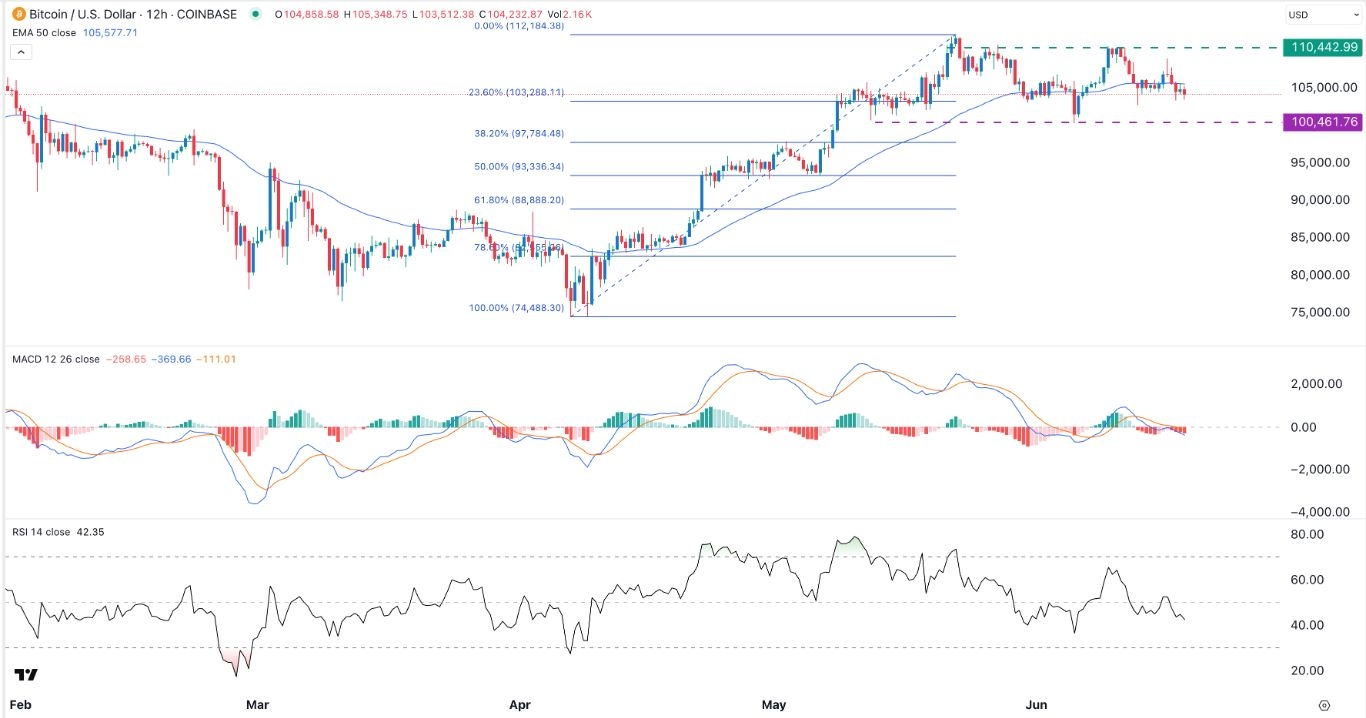
Bitcoin price pulled back in the past few days as investors book profits. The BTC/USD dropped from a high of 110,480 on June 9 to the current 103,500, its lowest point since June 6. It has dropped by over 7.4% from its highest point this year.
Bitcoin price retreated as investors booked profits and the crisis in the Middle East continued. There are signs that the crisis may escalate as the US has started evacuating its citizens from Iran.
A longer war in the Middle East will impact Bitcoin and other assets. For one, it will lead to higher crude oil prices, with Brent and West Texas Intermediate (WTI) rising to $76.75 and $73.58, respectively.
Shipping costs have also jumped. Combined, the two will likely lead to higher consumer inflation higher, which will make it harder for the Federal Reserve to cut interest rates. Bitcoin and other altcoins do well when the Fed is cutting interest rates.
The BTC/USD pair also retreated after the Federal Reserve delivered its interest rate decision. In a statement, the bank left interest rates unchanged between 4.25% and 4.50%.
The closely-watched dot plot showed that officials expect two rate cuts this year and four in 2026 and 2027. Jerome Powell insisted that the bank was well-positioned to wait before moving interest rates.
This rate hike pushed US bond yields higher, with the 10-year and 30-year hitting 4.40% and 4.90%, respectively. US stocks also retreated, with the Dow Jones falling by 50 points.
BTC/USD technical analysis
The 12-hour chart shows that the BTC/USD pair has been in a downtrend in the past few weeks. This retreat happened after the pair formed a double-top pattern at 110,440. A double-top is a bearish pattern that leads to more downside over time.
The pair has moved below the 50-period moving average, a sign that bears are in control. It remains slightly above the 23.6% Fibonacci Retracement level at 103,288.
The MACD and the Relative Strength Index (RSI) have continued pointing downwards. Therefore, the BTC/USD pair will likely continue falling as sellers target the neckline at 100,460. A drop below the neckline would point to more downside, potentially to the 38.2% retracement at 97,790.
More By This Author:
Is Broadcom Stock Price On The Cusp Of A Bullish Breakout?EUR/USD Forex Signal: Double-Top Points To More Downside Ahead Of FOMC
Nio Stock Price Has Crashed: Is It A Good Buy Today?
Disclosure: DailyForex will not be held liable for any loss or damage resulting from reliance on the information contained within this website including market news, analysis, trading signals ...
more


