BTC/USD Forex Signal: Bitcoin At Risk As Death Cross Nears
Bearish view
- Sell the BTC/USD pair and set a take-profit at 73,750.
- Add a stop-loss at 84,000.
- Timeline: 1-2 days.
Bullish view
- Buy the BTC/USD pair and set a take-profit at 84,000.
- Add a stop-loss at 73,750.
(Click on image to enlarge)
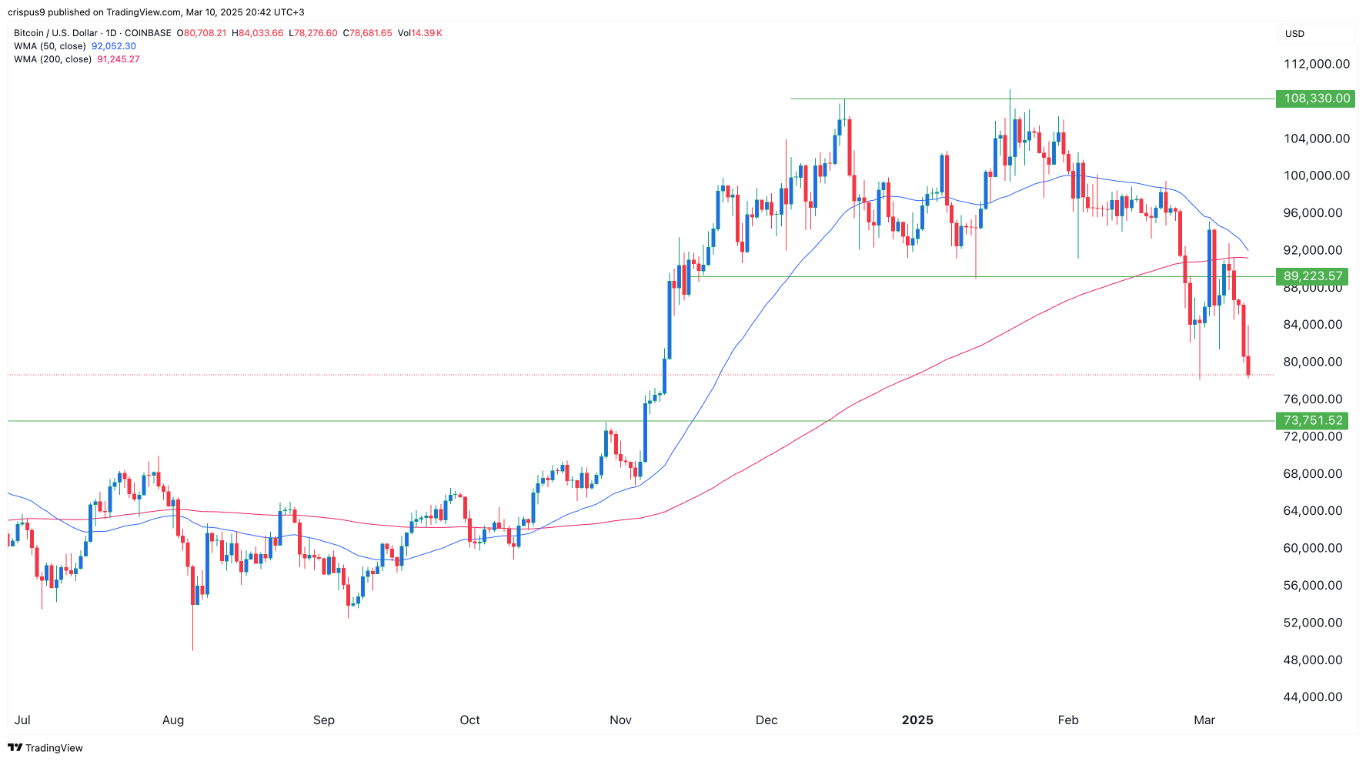
The BTC/USD pair continued its freefall this week, falling to its lowest level since November 2024 as demand waned. Bitcoin price fell to $78,500, much lower than the year-to-date high of $109,200. Other cryptocurrencies like Ethereum, XRP, and Cardano also continued their downward trend.
Bitcoin price crashed as demand among investors waned. For example, the cumulative total inflow in spot Bitcoin ETFs continued falling, reaching $36 billion. They have shed over $4 billion in the past few months. Similarly, Ethereum ETF outflows have continued rising, a sign that demand is waning.
Bitcoin’s crash coincided with the ongoing sell-off in the stock market, where the Dow Jones, S&P 500, and Russell 2000 indices fell by almost 2%. The tech-heavy Nasdaq 100 index plunged by over 3.8%, while the VIX index jumped by over 15%.
This decline is mostly associated with Donald Trump’s actions that threatens to upend the global economy. Trump has implemented tariffs on most imported goods, risking a major recession in the US and other countries.
The BTC/USD pair has also dropped after last week’s major events in which Donald Trump signed an executive order creating a digital Fort Knox made up of Bitcoin reserves. While this was a positive thing for the crypto industry, it will not lead to an immediate increase in Bitcoin purchases since it will only use Bitcoin in government’s custody.
The coin also crashed as investors sold the news after his meeting with top executives last week. He met with senior officials from major companies like Coinbase, Tether, Kraken, and Gemini and discussed ways of regulating the industry.
BTC/USD technical analysis
The daily chart shows that the BTC/USD pair peaked at 109,200 earlier this year and has now crashed to 78,500. It has dropped below the key support level at 89,200, the neckline of the double-top pattern.
Bitcoin has crashed below the 50-day and 200-day Weighted Moving Averages (WMA) and the two lines are about to form a death cross pattern. A death cross often leads to further declines.
Oscillators like the Relative Strength Index (RSI) and the MACD indicators have all pointed downwards. Therefore, Bitcoin price will likely continue falling as sellers target the key support level at $73,750, the highest point in March last year. More downside will be confirmed if the price moves below that support level.
More By This Author:
EUR/USD Forex Signal: Gets Overbought, Brief Pullback LikelyUSD/CNY Forecast: Renminbi Outlook As China Deflation Sticks
AUD/USD Forex Signal: Gains Ahead Of NFP Data
Disclosure: DailyForex will not be held liable for any loss or damage resulting from reliance on the information contained within this website including market news, analysis, trading signals ...
more


