BTC/USD Forex Signal: Bearish Flag Points To More Downside
The BTC/USD pair has started consolidating again as concerns about the health of the crypto industry remain.
Bearish view
- Sell the BTC/USD pair and set a take-profit at 25,255.
- Add a stop-loss at 26,500.
- Timeline: 1-2 days.
Bullish view
- Set a buy-stop at 26,290 and a take-profit at 28,000.
- Add a stop-loss at 25,255.
The BTC/USD pair remained in a tight range on Tuesday as traders reacted to last Friday’s crash and the soaring bond yields. Bitcoin was trading at $26,000, where it has been in the past few days. This price is much lower than last week’s high of $29,620.
Bitcoin consolidation resumes
The BTC/USD pair has started consolidating again as concerns about the health of the crypto industry remain. Some analysts believe that the sharp decline was a shakeout, which typically precedes a major bull run.
Others have opined that the plunge was the start of another bearish move since Bitcoin struggled to move above the important resistance level at $32,000. They cite the fact that demand for cryptocurrencies seems to be falling as evidenced by the low volume in centralized and decentralized exchanges.
The BTC/USD also remained in a tight range as investors reacted to the latest jump in US bond yields. The 10-year and 30-year yields soared to the highest level in more than a decade. A jump in bond yields is seen as a bad thing since it means that prices are falling.
Analysts believe that the rise of bond yields is happening as investors bet that the Federal Reserve will deliver at least one more rate hike in September. That hike will come at a difficult time for the market as mortgage and auto loans jump. Additional data shows that rate of defaults among consumers is rising.
Meanwhile, the Chinese economy is slowing as evidenced by the recent official data by the government. On Monday, the Peoples Bank of China (PBoC) decided to slash short-term interest rates to a record low.
BTC/USD technical analysis
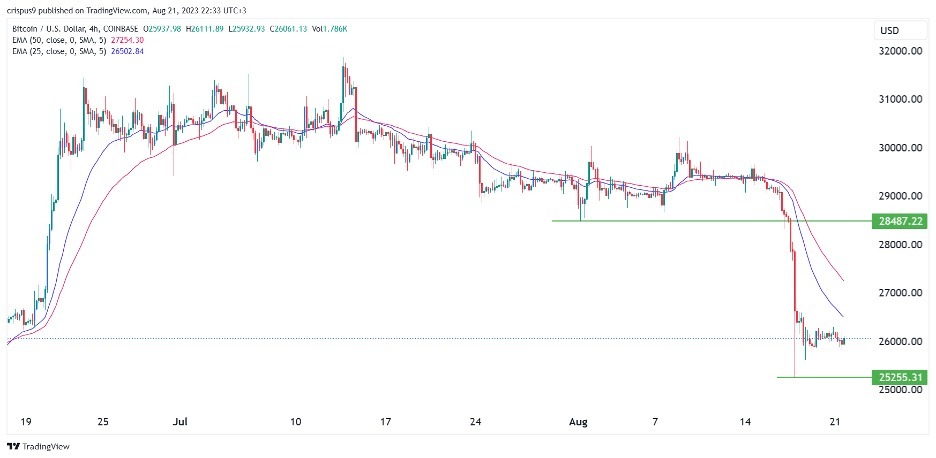
The BTC/USD pair has been in a tight range in the past few weeks. It has remained below the important support level at 28,487, the lowest level on August 1st. The pair has dropped below the 25-day and 50-day exponential moving averages. Volume has also fallen in the past few days.
The pair has also formed a bearish flag pattern, which is usually a bearish sign. Therefore, the pair will likely continue falling as sellers target the key support at 25,255, the lowest level last week.
(Click on image to enlarge)

More By This Author:
USD/JPY Technical Analysis: Strong Bull Control ContinuesGBP/USD Forex Signal: Prepares A Bullish Breakout To 1.2800
Gold Technical Analysis: Price is Lowest Level in Five Months
Disclosure: DailyForex will not be held liable for any loss or damage resulting from reliance on the information contained within this website including market news, analysis, trading signals ...
more


