
BTC/USD Forex Signal: Bearish Flag Points To A Drop Ahead
Bearish view
- Sell the BTC/USD pair and set a take-profit at 80,000.
- Add a stop-loss at 91,000.
- Timeline: 1-2 days.
Bullish view
- Buy the BTC/USD pair and set a take-profit at 91,000.
- Add a stop-loss at 80,500.
(Click on image to enlarge)
Bitcoin price stabilized at a key support level as the recent crash stalled. The BTC/USD pair was trading at 87,810, down sharply from the year-to-date high of 98,000.
Bitcoin wavered as the US Dollar Index (DXY) dropped to the lowest level in months. The dollar index dropped to $96, much lower than last year's high of $110.
Bitcoin also stabilized as the stock market rose, with the Dow Jones and the Nasdaq 100 indices rose by over 0.50%.
These events happened as market participants waited for the upcoming Federal Reserve interest rate decision on Wednesday. Economists polled by Reuters expect the bank to leave interest rates unchanged between 3.50% and 3.75%.
A hawkish Fed cut will be bullish for Bitcoin, while a hawkish one will lead to more downside in the near term.
Bitcoin will also react to the upcoming corporate earnings from some of the biggest companies in the United States like Microsoft, Tesla, and Apple. Other companies like Amazon and Google will publish their numbers next week.
The other key catalyst for the BTC/USD pair will be the potential government shutdown, which may happen later this week. Odds of this shutdown have jumped to over 78%.
Meanwhile, the BTC/USD pair will react to the potential US attack on Iran. A carrier group has arrived in the region, with pressure mounting for Trump to attack after the regime crossed his line of killing protesters.
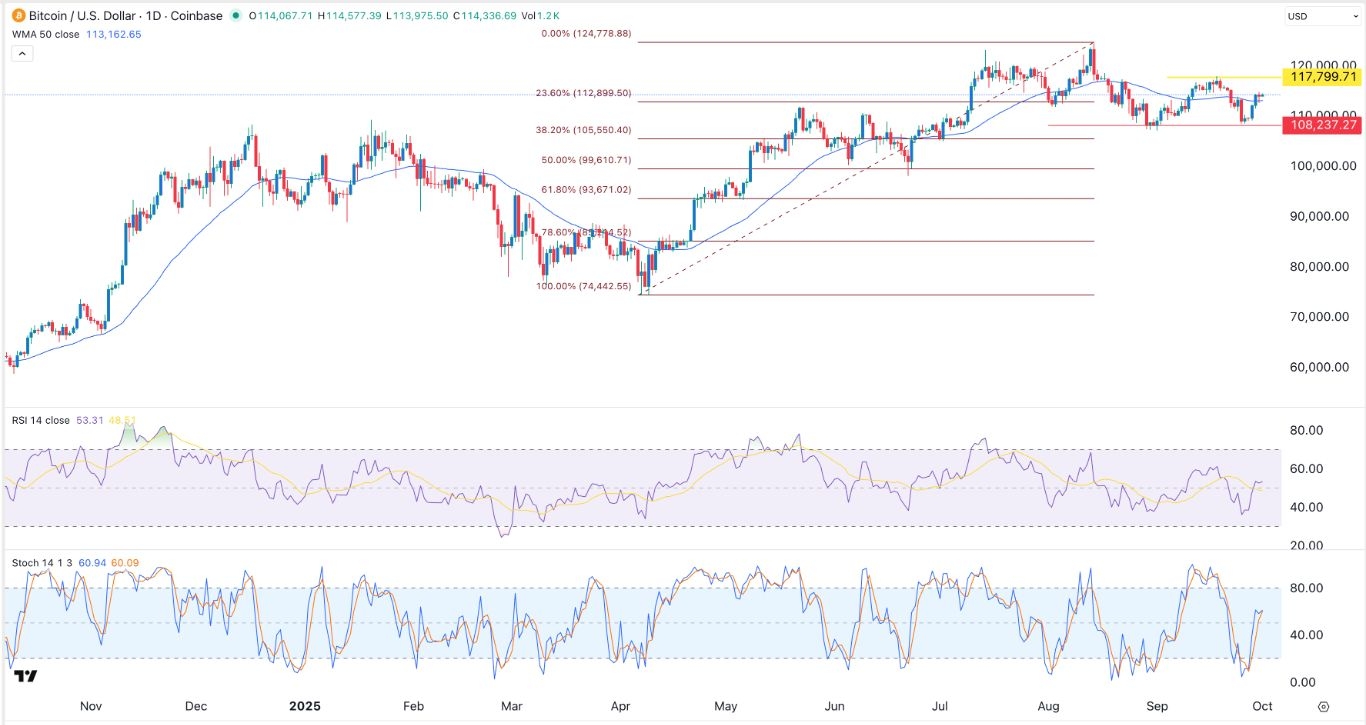
BTC/USD Technical Analysis
The daily timeframe chart shows that the BTC/USD pair has pulled back in the past few weeks, moving from a high of 97,970 earlier this month to the current 87,700.
It has moved below the 50-day and 100-day Exponential Moving Averages (EMA). The pair has also formed a bearish flag pattern, a popular continuation sign in technical analysis. The Relative Strength Index and the MACD have continued moving downwards.
Therefore, the most likely Bitcoin price forecast is bearish, with the next target being at 80,500. A move above the key resistance level at 90,600 will invalidate the bearish outlook.
More By This Author:
GBP/USD Forex Signal: Gains Momentum Amid Potential Fed And BoE DivergenceUSD/CAD Forecast Ahead Of BoC And Fed Interest Rate Decisions
Down 50% From Its 2025 Highs, Is GitLab Stock A Good Buy?
Risk Disclaimer: DailyForex will not be held liable for any loss or damage resulting from reliance on the information contained within this website including market news, analysis, trading signals ...
more

