BTC/USD Forex Signal: Bearish Divergence Pattern Forms
Bitcoin has remained in a tight range in the past few weeks.
Bearish view
- Sell the BTC/USD pair and set a take-profit at 35,000.
- Add a stop-loss at 38,000.
- Timeline: 1-2 days.
Bullish view
- Buy the BTC/USD pair and set a take-profit at 38,000.
- Add a stop-loss at 35,000.
Bitcoin price held quite steady above the key support level at $36,000 as traders waited for the next big catalyst. The BTC/USD pair was trading at 36,800 on Monday, much higher than last week’s low of 24,780. It is a few points below the year-to-date high of 38,000.
Waiting for the next catalyst
Bitcoin price has been muted in the past few days as the industry has had no major news. The most important news came out on Friday when the Securities and Exchange Commission (SEC) delayed the Bitcoin ETF by BitGo and Franklin Templeton.
Most analysts believe that the SEC will ultimately accept some or all of these ETFs at the same time. If this happens, analysts expect that there will be more Bitcoin inflows when these inflows are approved.
Other analysts suspect that the positive impact of a Bitcoin ETF approval will be short-term since the coin is already available to most investors. For one, the ProShares Bitcoin ETF (BITO), which tracks its futures, is already available to investors. It now has over $1 billion in assets.
The SEC has long been concerned about the viability of the safety of Bitcoin and other crypto ETFs. The regulators believe that Bitcoin is highly volatile and that it can be manipulated. Also, they see Bitcoin as a highly illiquid asset.
The BTC/USD price has also held steady as investors react to the ongoing macro events. The price of crude oil has pulled back from the year-to-date high of $95 to $80. Therefore, analysts expect that the Federal Reserve will maintain interest rates at the current level for a while.
The next important macro news to watch will be the upcoming minutes of the Federal Reserve. These minutes will provide more information about what to expect in next month’s meeting.
BTC/USD technical analysis
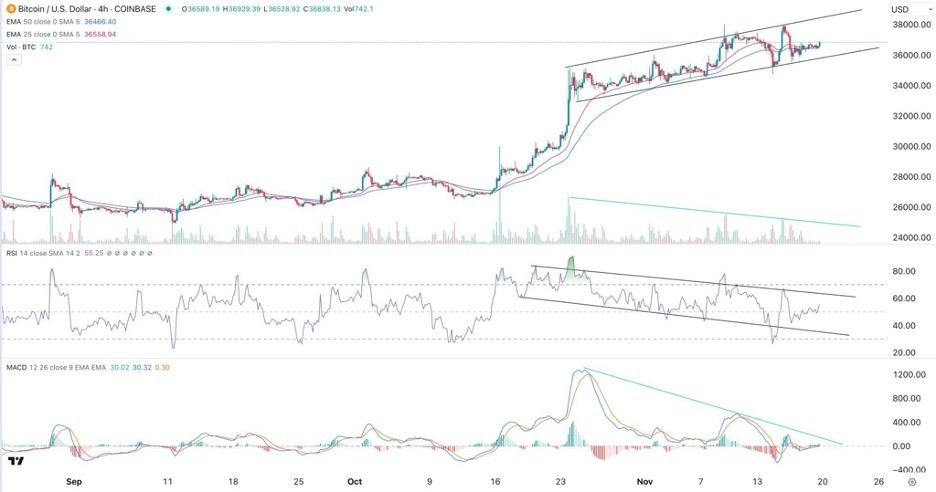
Bitcoin has remained in a tight range in the past few weeks. On the 4H chart, the BTC/USD pair has formed an ascending channel and is now at the middle point. A closer look shows that the volume has been moving in a downtrend.
Also, the Relative Strength Index (RSI) has formed a descending channel, signaling a bearish divergence. The MACD has also formed a bearish divergence. Therefore, the pair will likely have a bearish breakout in the coming days. This could see it drop to the next psychological level at 35,000.
(Click on image to enlarge)

More By This Author:
AUD/USD Forex Signal: Ripe For A Breakout As It Sits At A Key ResistanceGBP/USD: Weekly Forecast For Nov. 19-25
Trading Support And Resistance - Sunday, Nov. 19
Disclosure: DailyForex will not be held liable for any loss or damage resulting from reliance on the information contained within this website including market news, analysis, trading signals ...
more


