
BTC/USD Forex Signal: 1-Year Low At $74,725 Holds
Bitcoin has been breaking to new lows and underperforming other risky assets, but the bounce at the 1-year low price may signify the start of a bullish double bottom chart pattern.
My previous BTC/USD signal on 12th January was not triggered.
Today’s BTC/USD Signals
Risk 0.50% per trade.
Trades may only be entered before 5pm Tokyo time Tuesday.
Long Trade Ideas
- Long entry after a bullish price action reversal on the H1 timeframe following the next touch of $74,725, $73,620, or $72,095.
- the stop loss $100 below the local swing low.
- Adjust the stop loss to break even once the trade is $100 in profit by price.
- Remove 50% of the position as profit when the trade is $100 in profit by price and leave the remainder of the position to ride.
Short Trade Ideas
- Go short after a bullish price action reversal on the H1 timeframe following the next touch of $81,203, $84,501, or $91,614.
- Place the stop loss $100 above the local swing high.
- Adjust the stop loss to break even once the trade is $100 in profit by price.
- Remove 50% of the position as profit when the trade is $100 in profit by price and leave the remainder of the position to ride.
The best method to identify a classic “price action reversal” is for an hourly candle to close, such as a pin bar, a doji, an outside or even just an engulfing candle with a higher close. You can exploit these levels or zones by watching the price action that occurs at the given levels.
BTC/USD Analysis
In my last BTC/USD forecast three weeks ago, I thought that the crucial support zone between $89,019 and $88,611 would be pivotal. This was not a profitable actionable call on the day, but it was enough to keep out of trouble, as the price remained above this area and mostly rose over the day.
The technical picture now has changed and is very interesting.
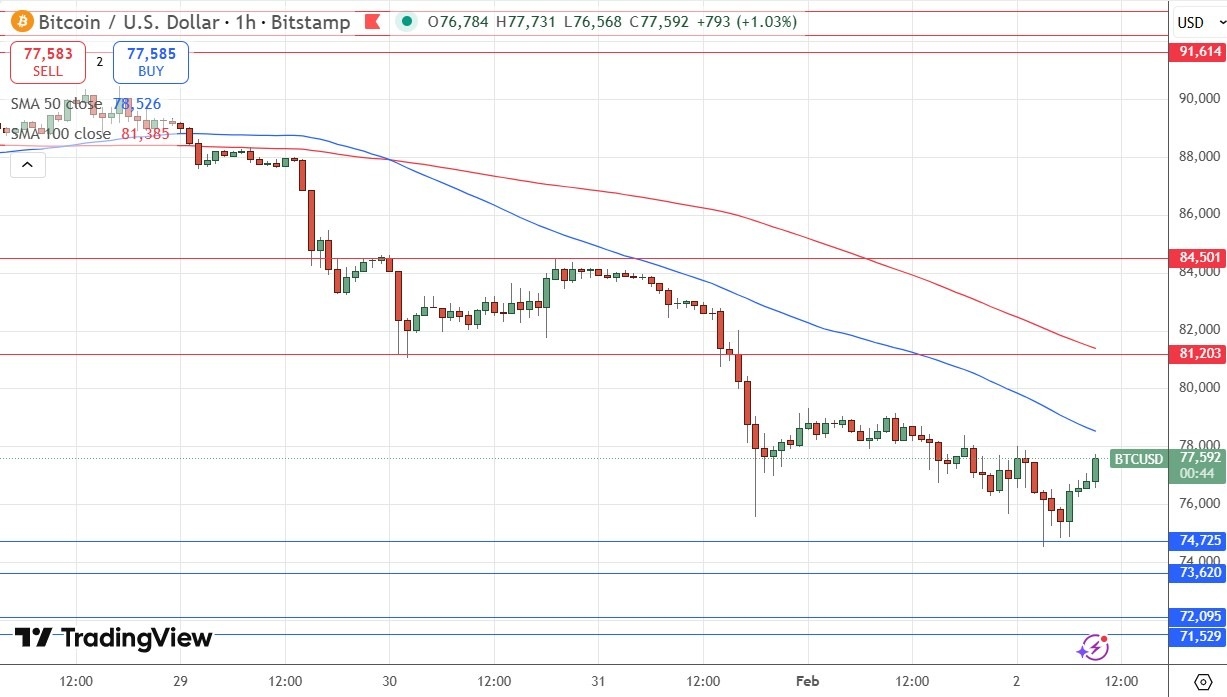
Bearish case: the price has fallen to touch a new 1-year low confluent with the support level at
$74,725. We have seen continuous breakdowns below support and a clear bearish trend, as can be easily seen in the price below. Bitcoin has also been performing poorly even while other assets such as stocks and commodities, which it is often positively correlated with, rose convincingly.
Bullish case: the rejection of the support level at $74,725 looks firm and represents the start of a bullish double bottom chart pattern which could be the start of a long-term rise in price.
The long trade looks speculative. I prefer a short trade following a retracement to the resistance level at $81,203 as this has been a key level, and is also now confluent with the 100-hour exponential moving average. A convincing rejection at a test from below would signify a short trade entry.
There has just been too much that is bearish about Bitcoin and crypto for me to not be comfortable with a short trade at an appropriate trigger.
(Click on image to enlarge)
There is nothing of high importance due today regarding Bitcoin. Concerning the US Dollar, there will be a release of ISM Manufacturing PMI at 3pm London time.
More By This Author:
AUD/USD Forex Signal: Strong Bullish Breakout Reaches $0.7000Weekly Forex Forecast – AUD/USD, EUR/USD, Silver, Gold
EUR/USD Forex Signal: Driven By EU/Trump Tensions, Tariffs
Risk Disclaimer: DailyForex will not be held liable for any loss or damage resulting from reliance on the information contained within this website including market news, analysis, trading signals ...
more

