
On Friday, we observed that something odd has been happening in the market. While stocks were tumbling, pushing most tech names into a deep bear market amid the worst turmoil for risk assets in years, inflows into stocks - both institutional and retail - have been soaring.
According to EPFR data compiled by Bank of America, cumulative equity flows year-to-date in 2021 have hit a record $153 billion, exceeding the pace of early-2021 (when the year started with $151 billion in inflows, ahead of a record year of more than $1 trillion in inflows).
"How can this be," we asked.
We answered that the catalyst behind this unprecedented scramble for risk "is that despite falling prices, investors are bailing on other even more impacted securities, and with a record outflows from money markets/cash as well as huge capital flight out of bond funds, this money has to go somewhere, and that 'somewhere' is stocks for now, even though if the Fed is indeed set to hike 7 times this year and drain $2+ trillion from its balance sheet, the pain for stocks is only just starting."
Over the weekend, Goldman desk trader Scott Rubner picked up on this peculiar flow dynamic. Roughly around the time that Goldman's chief equity strategist David Kostin was cutting the bank's year-end S&P price target to 4,900 from 5,100, Rubner wrote that "with money flowing into global equities 'at extreme levels,' this would need to change before a larger correction can take place."
"I would turn bearish if the money slows or reverses" he said, adding that "portfolio rebalances of this size typically last for the full quarter (Q1 2022)." Rubner also reminds that the "headlines will continue to be robust through March (i.e., advisor quarter-end rebalancing), with the March 4 NFP, March 10 February CPI, March 16 FOMC Meeting, etc."
Here are the key observations from a still bullish Rubner, as the market continues to crack and remains unable sustain even a modest bounce,
1. Global Equities logged a massive $46.571 billion worth of inflows this week.
This is the fourth largest weekly inflow into Global Equities on record. This works out to $9.3 billion's worth of inflows per day this week. This increased by +220% week-over-week.
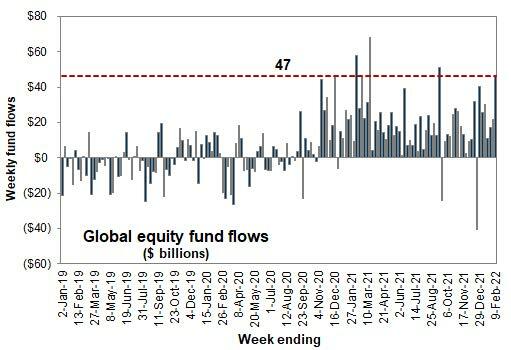
2. Adjust for quarterly rebalances (inflows one week vs. outflows the next), and this is the second largest weekly inflow on record.
The largest weekly inflow was $58.087 billion, which happened this exact week in 2021.
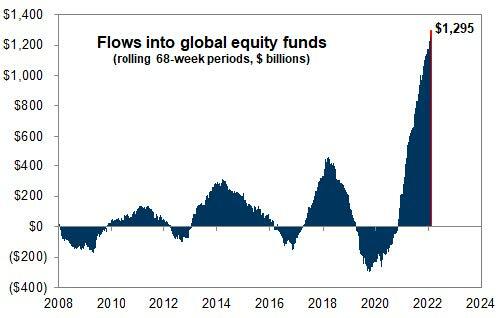
3. Global Equities have logged $152.50 billion's worth of year-to-date inflows.
This annualizes to $1.322 trillion. There have been 27 trading days this year, or $5.7 billion inflows per day.
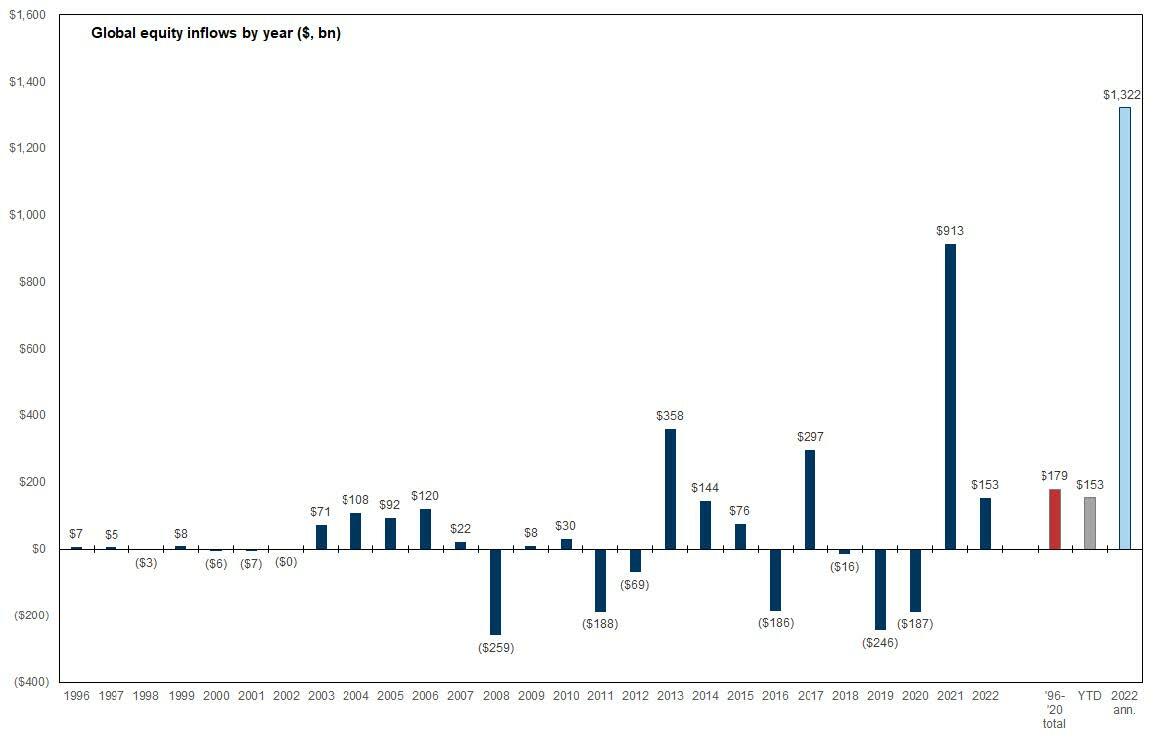
4. 2021 logged more equity inflows, $913 billion, than the prior 25 years combined.
2022 is on pace to exceed this number by 45%. Rubner writes that "in 2009, I officially retired the term 'Great Rotation,' or the movement of capital out of fixed income into equities, from my weekly emails and IB chat rooms. I switched this portfolio shift into the 'Wedge,' which was the movement of capital into bonds and cash, and out of equities."
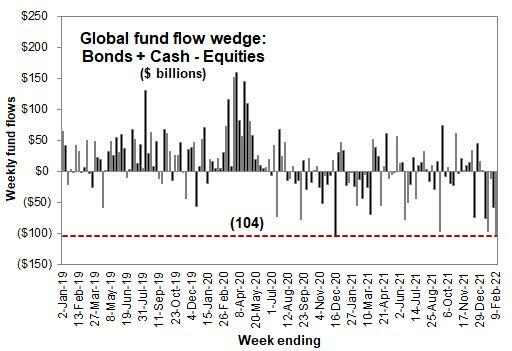
But, as the Goldman trader notes, "if this shift of money continues at this rapid of a pace, I am adding back 'Great Rotation' into the mix, as I expect the wedge needs to shrink given the trajectory of inflation."
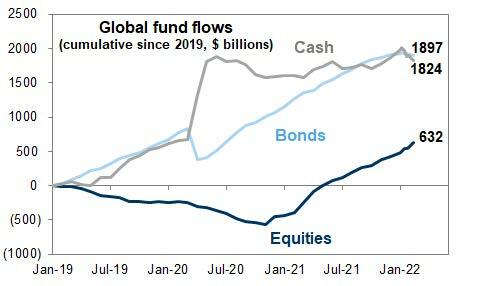
5. Since Jan. 1, 2019, three years ago, cash has seen $1.897 trillion worth of inflows, bonds have seen $1.824 trillion worth of inflows, and equities just $632 billion.
This makes the GS wedge $3.08 trillion.
6. Goldman are introducing the “anti-portfolio” asset allocation theme.
"This has been the core of my zoom calls with allocators this week," Rubner writes.
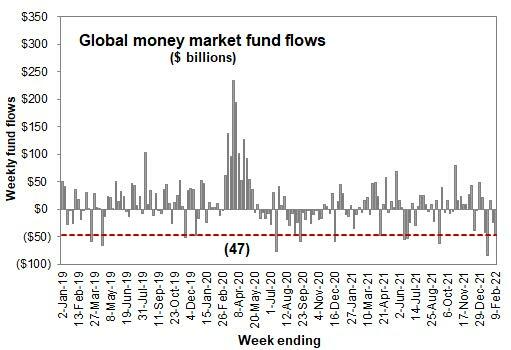
Money Market Outflows
7. Cash saw outflows of -$47.5 billion this week.
This funded the allocation to equities this week. Cash has seen substantial outflows year-to-date.
Bond Outflows
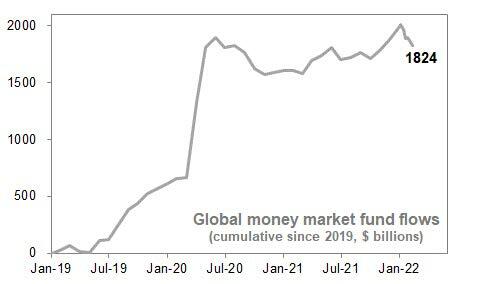
8. The current cash AUM is $4.593 trillion, which clearly overstates “cash on the sidelines.”
However, the point is that this is a massive cash pile, which is earning a deeply negative inflation adjusted yield. $1.824 trillion's worth of cash was raised since 2019.
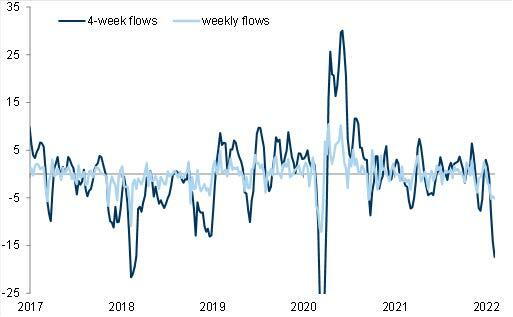
9. Global Bond outflows are now accelerating.
I have been looking at this chart for the last 19 years. It’s rare to see bond outflows. Global bonds have seen outflows every week of 2022. They happen in clusters. In other words, when CNBC says that the outlook for bond allocation is not positive, the “Robo-Advisor” ETF allocation will trim passive bond allocations. This is the anti-portfolio.
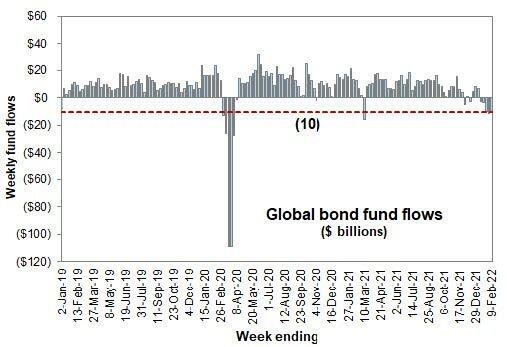
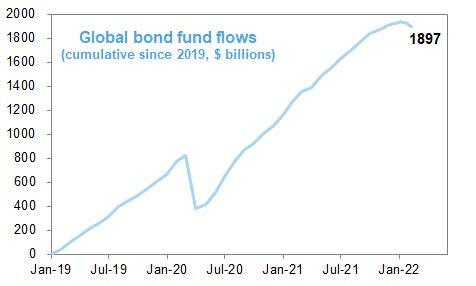
10. Global Bonds have seen $1.897 trillion's worth of inflows in the last three years.
This chart looks very “toppish.”
Credit Outflows
11. Global HY credit seems to be the place, which has benefited from this dynamic.
Capital is rolling out of credit. I am among the crowd that is tracking “passive credit outflows,” which I am watching closely. Put open interest in most of these products is at record levels.
Rest-of-World Equities
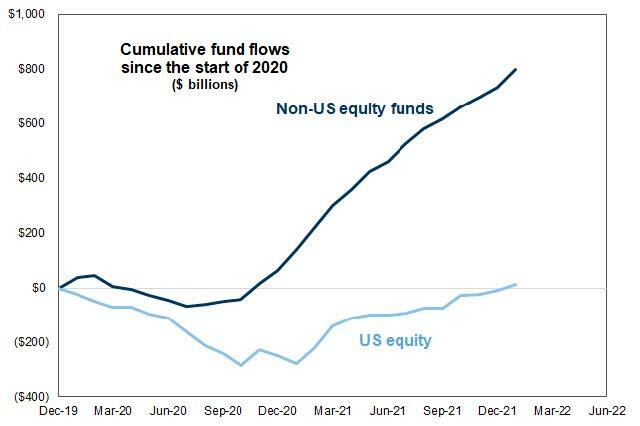
12. Rest of World Equity Allocation is the anti-portfolio allocation.
2022 money is not going into growth/tech/USA.
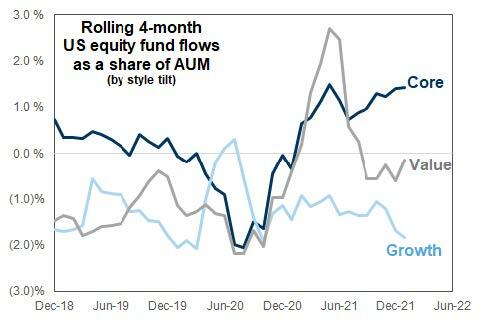
13. Non-US dollar equity allocations have scope to add, and this is where the money is flowing.
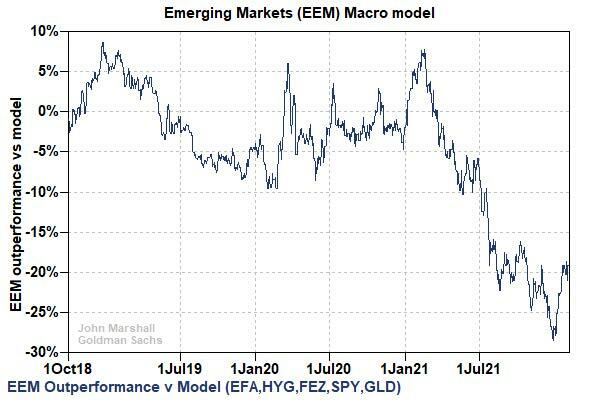
14. Rubner writes that "Emerging Market Equities are resonating with clients. I sent out a note this week to asset allocators on Re-Emerging Markets. This is the most feedback that I have gotten on overall interest in EM again in years. The broad index has underperformed its historical relationship by 20% in the past year. (ie Brazil is up 17% year-to-date vs. SPX -5% year-to-date). There is anti-portfolio scope to add."
15. Does the inflow picture change in March?
As Rubner concludes, "retail is deploying record capital into the equity market, as is corporates, and systematic supply has abated. Not all clear, but there is a lot of capital looking for a home."
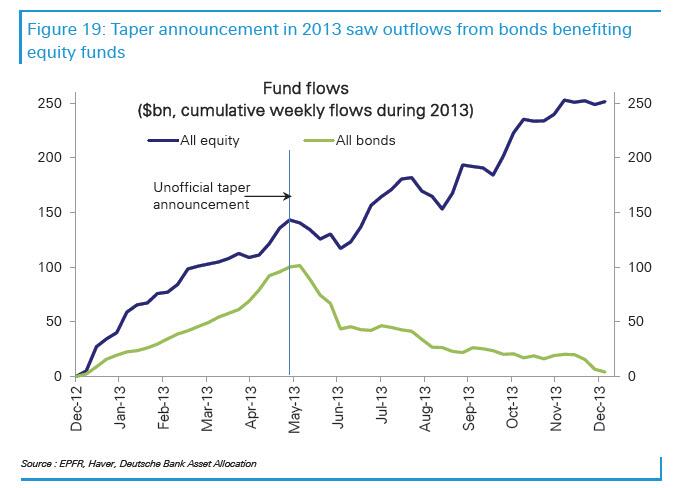
One final chart, this one from Deutsche Bank's Parag Thatte, confirms what we said on Friday - that even though tapering should in theory hit risk assets, the hit to even more overvalued bonds will result in funds flowing from bonds to equities, thereby keeping stocks and other risk assets artificially elevated on the back of continued selloff in bonds, until either the selling reverses fully or everything is finally dragged down together.


Comments
Log in or sign up to join the conversation.