Understanding The Yield Curve
The yield curve is said to be steepening when the gap between long-term interest and short-term interest rates is increasing, but the meaning of the steepening is different depending on whether it is being driven by rising long-term interest rates or falling short-term interest rates. Also, the yield curve is said to be flattening when the gap between long-term interest and short-term interest rates is decreasing, but the meaning of the flattening is different depending on whether it is being driven by falling long-term interest rates or rising short-term interest rates. The two possible yield curve trends (steepening or flattening) and the two main ways that each of these trends can come about the result in four different yield curve scenarios as outlined below.
- A steepening curve driven by rising long-term interest rates (that is, a steepening of the curve along with flat or rising short-term interest rates).
This is indicative of rising inflation expectations. It tends to be bullish for commodities, cyclical sectors of the stock market and relatively high-risk equities and credit. It is bearish for long-dated treasuries.
- A steepening curve driven by falling short-term interest rates.
This is indicative of declining liquidity and a general shift away from risk. It is bullish for all treasury securities (especially short-dated treasuries) and gold. It is bearish for almost all equities and especially bearish for cyclical and relatively high-risk equities. It is also bearish for commodities and high-yield credit.
- A flattening curve along with rising short-term interest rates.
This is indicative of increasing urgency to borrow short to lend/invest long and a general shift towards risk. It tends to be bullish for most equities and high-yield credit. It is bearish for gold and short-dated treasury securities.
- A flattening curve driven by falling long-term interest rates (that is, a flattening of the curve along with flat or falling short-term interest rates).
This is indicative of declining inflation expectations and an increasing aversion to risk. It tends to be bullish for gold, long-dated treasuries and relatively low-risk equities. It tends to be bearish for cyclical stocks and high-yield credit.
In general, scenarios 1 and 3 arise during economic booms, scenario 2 is a characteristic of an economic bust and scenario 4 occurs during a boom-to-bust transition.
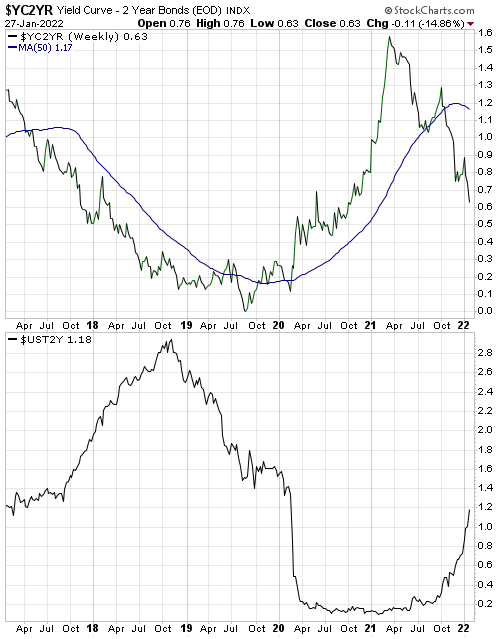
The top section of the following chart shows that the 10yr-2yr yield spread, which is one of the most popular measures of the US yield curve, has been declining (indicating a flattening yield curve) since March of 2021. The bottom section of the same chart shows that the yield-curve flattening has occurred in parallel with a rising 2-year yield, meaning that for the past several months we have had yield curve scenario 3. This is evidence that the boom continues. However, a shift to yield curve scenario 4 (indicating a boom to bust transition) could happen soon.


