Today’s Yield Curve Steepening Is Not Different This Time, It’s Not The Same

Image by Thomas Malyska from Pixabay
Investment volatility remained elevated this year. One can point to any number of culprits. My preferred cause has been interest rate volatility. I’ve been cautious as the Federal Reserve (Fed) raised its benchmark rate. However, a popular risk indicator has recently been sending a mixed message. The yield curve has been steepening. Thus, the investment environment might be changing, requiring different portfolio positioning. Upon further examination, though, I find myself pondering the most dangerous investment thoughts possible: Could this time be different?
As far as investment signals go, it’s hard to beat the shape of the yield curve. It’s one of the most studied and reliable recessionary indicators. While the yield curve’s October 2022 inversion captured much attention, so too has its rapid steepening. However, a look under the hood reveals that it might not be the call-to-action signal for which I was waiting.
Inversions and recessions
Economists have long studied the relationship between the shape of the yield curve and economic performance in the U.S. While specific curve choices vary, they typically compare yields for the 3-month U.S. Treasury bill (3mUST) to the 10-year U.S. Treasury note (10yUST). Normally, this curve is positively sloped, exhibiting a “term premium” whereby longer-dated bonds yield more than shorter-dated ones. However, on rare occasion it inverts such that the 3mUST yields more than the 10yUST. When these occur recessions typically follow making them noteworthy events.
While economists have yet to establish a direct, causal link between U.S. treasury yield curve (USTYC) inversions and recessions, they’ve devised several explanatory theories. One speculates that investors anticipate the dampening effect of high short-term rates on economic growth leading them to bid up (and thus lower the yield for) long-term bonds as higher borrowing costs reduce current investment and consumption thereby lowering future economic activity for which investors should demand lower yields. There are others too.
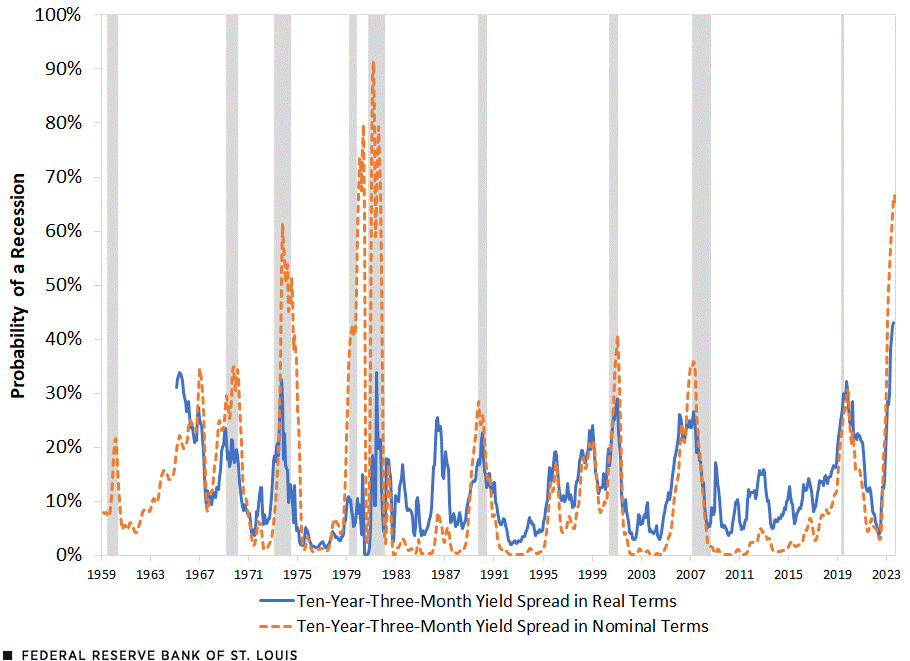
While such theories certainly merit debate, the empirics do not. Recessions frequently follow USTYC inversions. Thus, many models have been built to predict the former by the latter. One, constructed by economists at the Federal Reserve Bank of St. Louis, for example, forecasted a “65% probability of recession in 12 months” in September.
(Click on image to enlarge)

Economists at the Federal Reserve Bank of St. Louis forecasted a 65% probability of recession in 12 months in September. Source: Federal Reserve Bank of St. Louis
Yield curves not recessions
Many investors fret recessions, yet, I don’t. I’m far less concerned with them than with changing asset prices. It turns out that yield curve inversions can help with those too.
In a recent letter, Perquisite Capital’s Chief Investment Officer, Daniel Want, discussed the historical relationships between stocks, bonds, and the shape of the U.S. treasury yield curve. He noted that “some of the best [U.S. Treasury bond] buying opportunities in history present themselves when the yield curve has been inverted … and is starting to come out of that inversion back into a ‘steepening’ condition” and that “global equities can also be seen to struggle after the last rate hike.” Thus, Want, like many other investors, is keenly watching for changes in the shape of USTYC. He’s likely devising strategies to profit from the changing investment performance that typically accompanies curve steepenings.
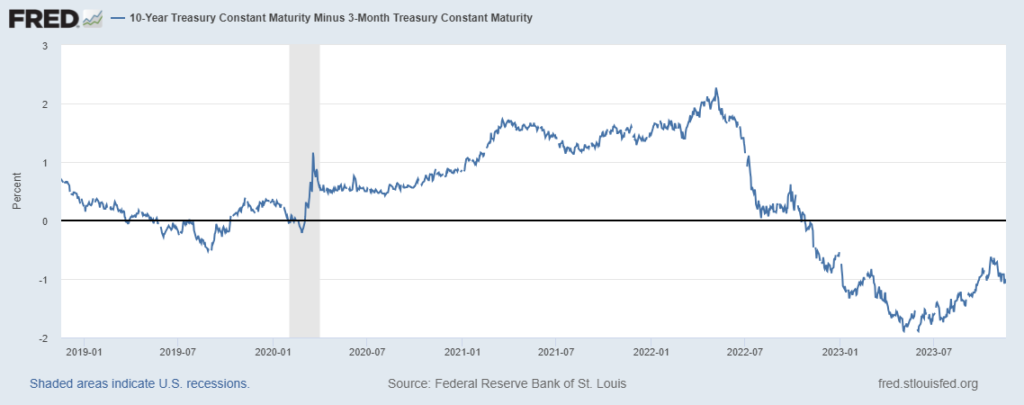
The USTYC first inverted in October 2022. However, it recently began to steepen, rising from a low of -185 bps in May to -106 bps today. While still inverted, it caught my attention for the reasons Want articulates. While debates rage on about if and when a recession might occur in the media, I’m focused on the USTYC’s potential investment implications for my portfolio.
(Click on image to enlarge)

The USTYC recently began to steepen from its inverted lows. Source: Federal Reserve Bank of St. Louis
Not all steepenings are created equally
However, not all USTYC steepenings are created equally. They can occur in two ways. Either the front end’s yield can fall faster than the long end’s (which can also fall, rise, or stay stable), or the back end’s can rise faster than the front end’s (which can also rise, fall, or stay stable). The former is called a bull steepener and the latter a bear steepener referring to the appreciation and deprecation of bond prices causing the respective changes. The implications of each would likely differ.
For example, falling yields have historically generated strong returns for bonds as their prices appreciated in response. Bond returns commonly suffered when yields rose (caused by their price drop). Thus, considering how the yield curve might steepen becomes critically important when devising investment strategies for such scenarios. It’s as important as when.
Below, I share some snapshots of the last 9 USTYC steepenings (gray line). Interestingly, 7 occurred by bull steepenings where the yields for 3mUSTs (red line) dropped faster than for 10YUSTs (black line). Just 2, 1979-1981’s yield curve steepening and today’s, resulted from a bear steepening (i.e. the faster rise in 10yUST yields).
(Click on image to enlarge)


Snapshots of the last 9 USTYC steepenings (gray line). Source: Federal Reserve Bank of St. Louis
Not all yield curves have steepened for the same reason. Today’s “how” differs from most others. Thus, I hesitate to approach today’s generically, like the rest.
A carry trade carries my investment approach
As if yield inversions weren’t rare enough, it’s only steepened once before due to the rise in 10yUSTs compared to 3mUSTs. Thus, we can hardly draw robust statistical conclusions from history. Trading today’s requires a more inductive approach.
As noted elsewhere, I mentally model investment markets as (leveraged) carry trades. The largest participants invest with borrowed money: commercial banks invest customer deposits, insurance companies invest premiums, pension funds invest contributions, and hedge funds, mutual funds, and individuals can invest on margin. Even derivative transactions embed leverage. Thus, I view the relationship between borrowing rates and asset yields as important to investing.
Carry trades can be fantastically profitable so long as investment yields remain higher than borrowing costs (and liquidity is expertly managed). As a result of their leverage, carry trades are very sensitive to changes in both. Small rises in borrowing costs and/or falling investment returns can force them to unwind. Since credit curves typically exhibit a positive term premium, carry trades commonly borrow short and lend long. Banks, insurers, pension funds, investment funds, etc. all behave this way. As a result, volatility and yield curve inversions can mortally wound carry trades.
In this carry trade framework, the way in which the yield curve steepens takes center stage. Falling short-end yields help stabilize them. They lower borrowing costs and leave asset prices (relatively) unaffected. As a result, carry trade profits and the capacity for leverage increase thereby stoking demand for assets. Thus, a yield curve steepening created by falling 3mUSTs could create a favorable, long-risk environment. As previously noted, yield curve steepenings commonly followed this pattern.
However, today’s steepening results from the opposite conditions. 10yUST yields are rising relative to 3mUSTs’. While the investment spread first appears to be increasing (positive), the impact on existing investments can be detrimental. Falling bond prices (produced by higher yields) could affect other assets and lower their returns. As a result, carry trade profits can compress leading to a reduction in borrowing capacity, unwinding of leverage, forced selling of assets, and lower prices. In this framework, rising interest rates can destabilize financial markets, creating less favorable investment conditions.
Not different, not the same
Economists and investors commonly monitor the shape of the USTYC. It typically exhibits a positive term premium with longer-dated maturities yielding more than shorter-dated ones to reflect various risks and time-value of money considerations. However, it sometimes inverts. These have reliably predated past U.S. recessions. As a result, many market participants incorporate the USTYC’s shape into their analyses.
Thus, the recent USTYC steepening from its inverted lows has garnered much attention. However, the way in which the USTYC has thus far steepened differs from most others. Today’s results from a greater rise in long-term yield rather than from a drop in short-term ones which more commonly occurred.
This important difference, in my opinion, reduces the reliability of historical investment performance analogs. I see the rise in long-term yields as potentially destabilizing as I mentally model financial markets as a carry trade. As a result, I’ve maintained a conservative investment posture.
To be sure, the USTYC has just begun to steepen and remains inverted. The process is far from complete. I will undoubtedly update my views as the USTYC steepening conditions change. I’m not reluctant to rely on past steepenings’ investment performance because I think it’s different this time. Rather, I just don’t think it’s the same (so far).
More By This Author:
Treat Alternatives Like Cuisines, Not Distinct AssetsLogically Defining Money Makes Cents
The Similarities & Differences Between Today & The GFC


