
Treasury bond TLT is nicely bouncing from projected strong multi-month support after a completed wedge pattern. One of the reason for a change in trend here in the last two weeks is inflation in the US which is coming down to 3% so specuatlors believ e that FED is close to end the hiking cycles, thus yields are coming down with USD. Looking at the TLT, price is recovering ion an impulsive fashion for the last two weeks, which can be important evidence for more gains later on, at least for a three wave A/1-B/2-C/3 structure, up to minium 104 – 107 area.
(Click on image to enlarge)
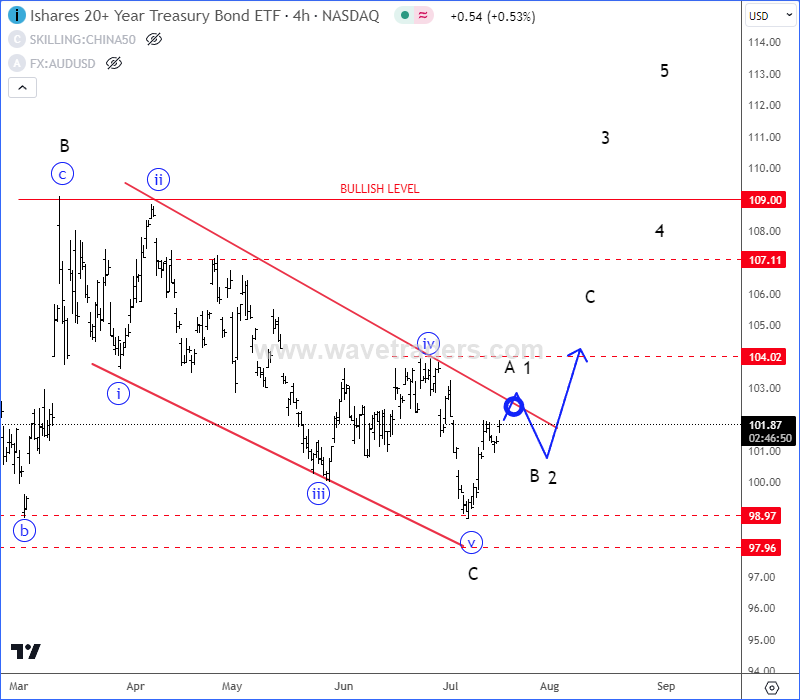
TLT 4H Chart
As said above, bounce is coming due to falling US yields and also from the recovery of Japanese Yen. TLT and USDJPY are in negative correlation, we just inverted the USDJPY chart for clearer visibility.
(Click on image to enlarge)
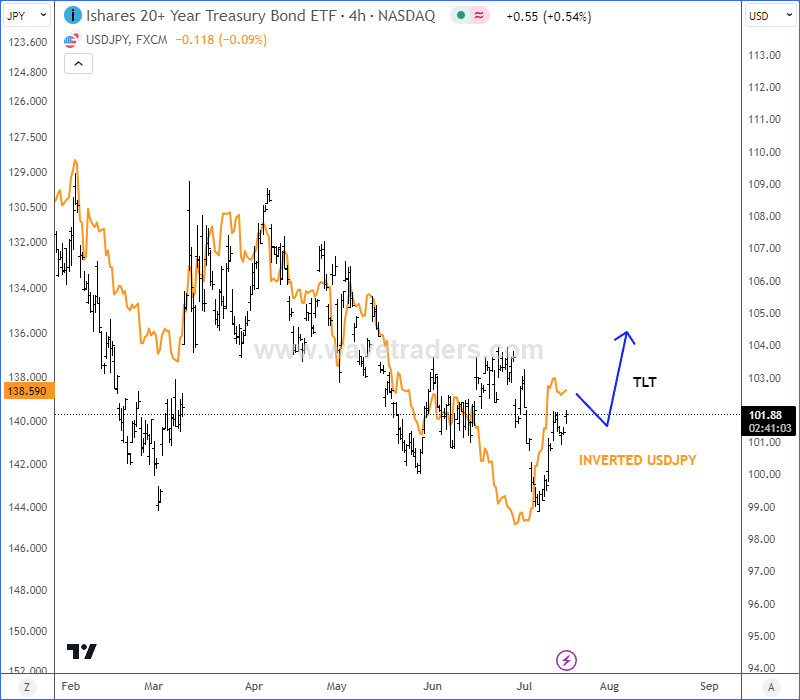
TLT vs. Inverted USDJPY
Also, its important to note that USDJPY turned sharply down from 145 resistance area; its a clear impulse therefore market has room for more weakness after rally. We will favour shorts on this pair, while pair trades below 145.06.
(Click on image to enlarge)
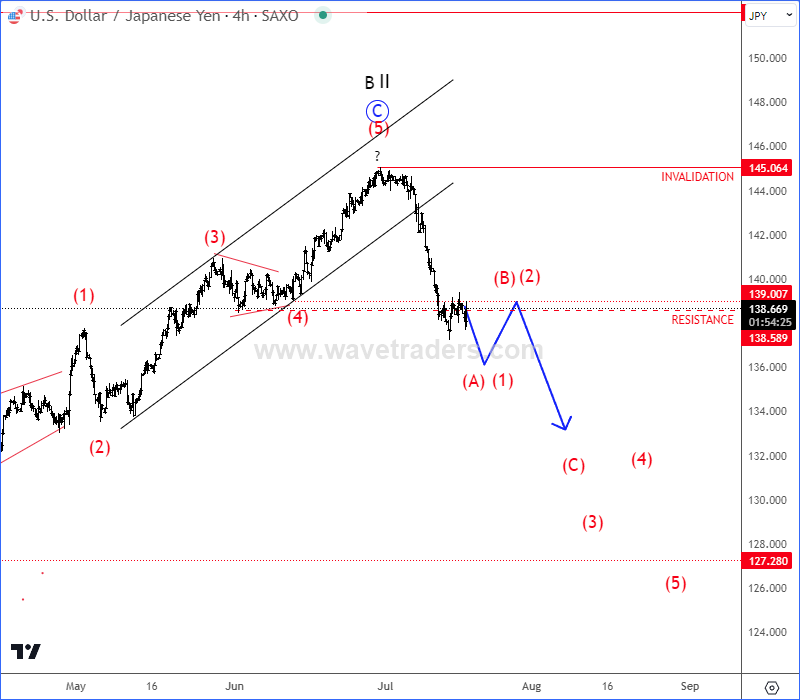
USDJPY 4H Chart
More By This Author:
Elliott Wave Analysis: Ethereum Is Pointing Higher
USDCAD: Making An Intraday Recovery
GBPAUD And GBPNZD Pairs May Have Found The Resistance


Comments
Log in or sign up to join the conversation.