
On August 19, 2014, Taylor Swift released her hit song “Shake it Off.”It was nominated for three Grammy awards in 2015 and named one of the 10 songs that defined the 2010s by USA Today. The key lyrics that relate to the current state of the stock market are as follows:
But I keep cruising
Can’t stop, won’t stop moving
It’s like I got this music in my mind
Saying it’s gonna be alright
‘Cause the players gonna play, play, play, play, play
And the haters gonna hate, hate, hate, hate, hate
Baby, I’m just gonna shake, shake, shake, shake, shake
I shake it off, I shake it off (whoo-hoo-hoo)
To the dismay of perma-bears, while the market grapples with a War in Ukraine, persistent inflation, a hawkish Fed, a yield curve that inverted and a global rolling wave of a pandemic/shutdowns – the S&P 500 is down just 4.3% YTD.
Fox Business
The afternoon – after the Fed Minutes were released – I joined Liz Claman on Fox Business – The Claman Countdown – to discuss my outlook after the hawkish moves from the Fed. Thanks to Liz and Ellie Terrett for having me on.
Here were my Show Notes ahead of the segment:
Yesterday and today’s market weakness is likely another instance of, “Sell the rumor, buy the news!”
-Not a surprise as Powell already signaled at the last meeting that balance sheet reduction could begin as early as May.
-Futures currently implying 78.8% chance of 50bps hike in May.
–Perspective: 10yr yield touched ~2.63% today. Peaked at 3.25% in Oct 2018, and 3.03% in Jan 2014.
Bad News: 2/10 spread inverted this week which likely means we will have a shallow recession in mid to late 2023.
Good News: Stock Market can still work up to new highs in the coming months.
Why? Just as stimulus hits the economy on a lagged basis (6-12 months after it starts), the same is true with tightening.
–Earnings Estimates still going UP: from $225 to $227.80 in ~last mo.
Data:
-Since 1900 There have been 28 instances where the yield curve has inverted; in 22 of these episodes, a recession has followed. The lag between curve inversion and the start of a recession has averaged about 22 months.
–Since 1977, there have been 8 yield curve inversions. The S&P 500’s average return in the following year was +11.5%, with dividends +15.2%. Inversions are not a good signal to short stocks.
-The last 4 times the 2/10 yr yield curve inverted shows the S&P 500 rallied for another 17 months and gained 28.8% until the ultimate peak.
What to do?
-Enter sectors that:
1) have reasonable valuations, and
2) can thrive in a slowing growth environment and have low correlation to GDP. GDP will slow from 5.9% 2021 to ~3.5-4% 2022.
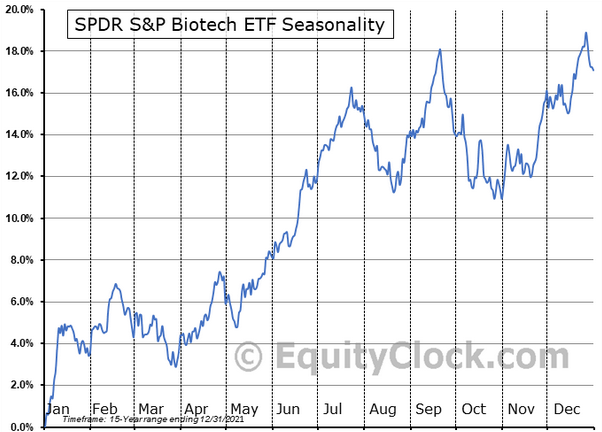
Biotech (ETF: XBI – play a basket) Fits the Bill:
–Unlike Cyclicals – which require accelerating GDP to flourish – Biotech has a low correlation.
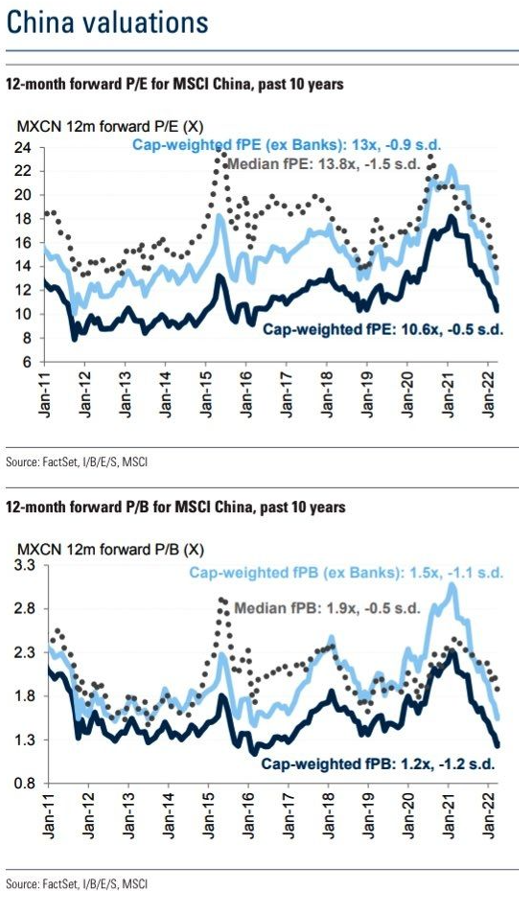
-Biotech valuations are historically low (relative to their average multiples since 1986). Implies the sector should appreciate:
~24% – to get back to average Price to Book multiple.
~155% – to get back to average Price to Operating Cash Flow multiple.
~112% – to get back to average Forward P/E multiple.
–36% of components of XBI trading at 3x cash on balance sheet or less.
–16% of components of XBI trading at 2x cash on balance sheet or less.
-Many trading at a discount to cash on balance sheet.
-Lowest price/sales ratio in over a decade.
2 Catalysts:
- Doctor visits, screenings, and scripts are accelerating as covid winds down. Sales Reps are back on the road meeting with Doctors in person.
- M&A The cash balance of Russell 3000 Health Care companies exceeds $500B.This is up ~400% in the past 20 years. With Big Pharma losing their patents on many blockbuster drugs, but having tons of cash on their balance sheets, they will be forced to aggressively BUY innovation in the Biotech sector to maintain/accelerate growth.
Other Indicators
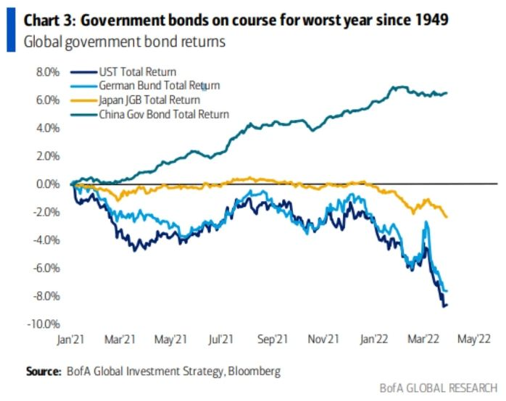
We may be close to a short term peak in yields – bottom in bonds:
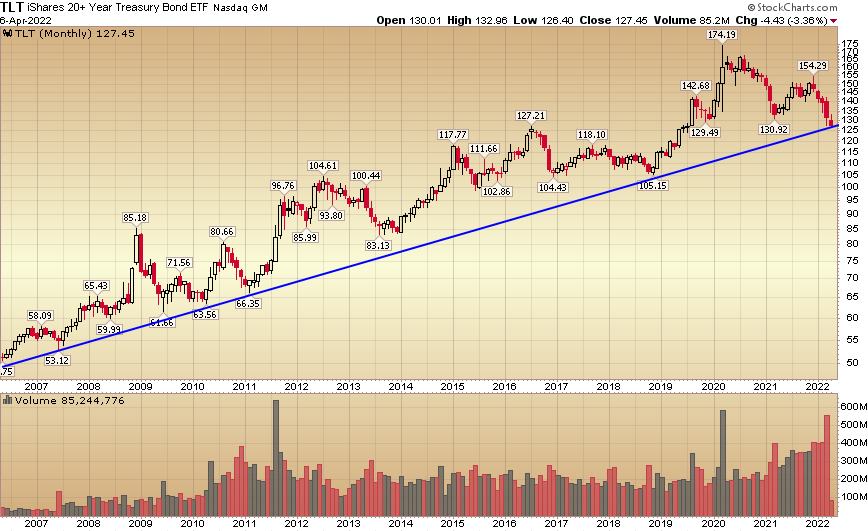
Our relative yields are becoming too attractive to foreign buyers at these levels. One can borrow in yen or euros and mint money buying our Treasuries at these levels. As I said in the segment with Liz, I think we’re at a “sell the (QT) rumor, buy the news” point in time.
Any relief in yields will begin to favor that which no one is currently positioned for: 1) biotech and 2) value (low multiple) tech. As everyone has crowded into cyclicals in the past few weeks and dumped their tech, the pain trade is UP for these two groups.
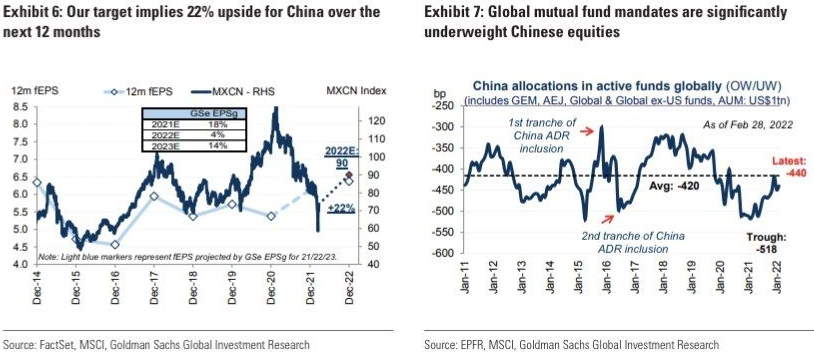
When this reversal occurs, those who are chasing what has worked in the recent past are going to get let out through the trap door. As you can see from the recent table I edited below, “The Last Shall Be First.”Right now EVERYONE wants commodities, NO ONE wants Emerging Markets (i.e. CHINA as it is the largest weighting by far). But history shows OVER AND OVER, the “Last Shall Be First” and the mighty can fall from grace:
(Click on image to enlarge)
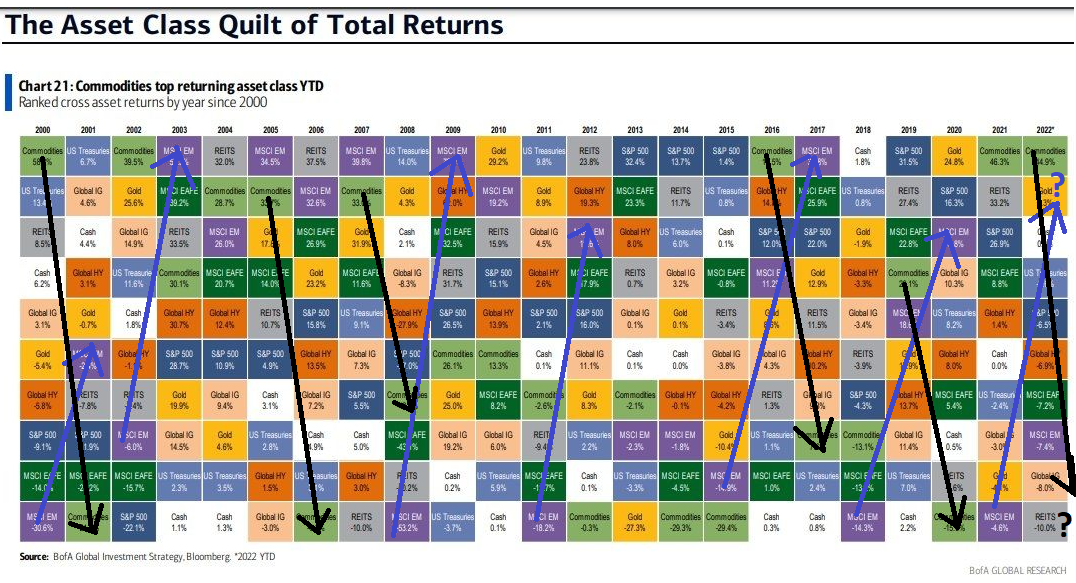
Emerging Markets/China Tech was the worst performer in 2021. We expect that will change in 2022 – just as it has every few years. Commodities held the top spot in 2021. That is unlikely to persist in 2022 – DESPITE the strong start. This is an out-of-consensus view. Follow the blue arrows for Emerging Markets/China and the black arrows for commodities. Then draw your own conclusions…
The Fed Minutes indicated that Quantitative Tightening (balance sheet rolloff) would begin in May and work up to a cap of $95B/mo ($60B Treasuries and $35B MBS). We could also potentially get a 50bps hike in May.
Pointing to our show notes from above, let’s take a look at how Biotech performed during the last tightening cycle from 2016-2018:
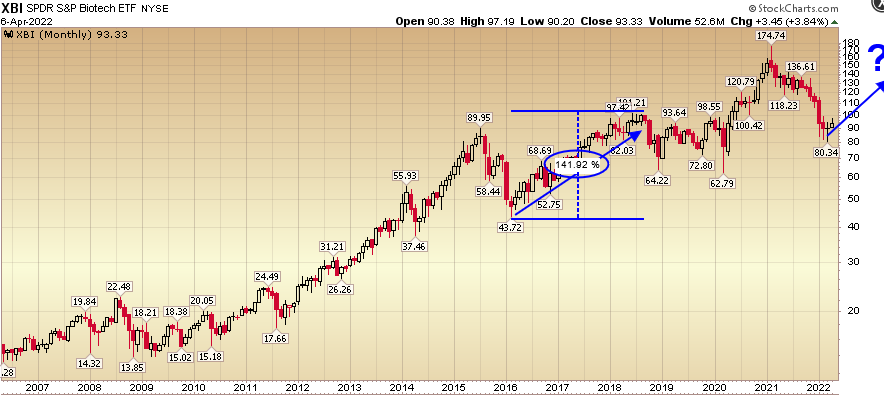
St. Louis Fed: In December 2015 the Fed took the first step toward returning the policy rate to a more neutral level. The FOMC raised the target range for the federal funds rate from 0%-0.25% to 0.25%-0.5%. Another increase in 2016, three increases in 2017, and four increases in 2018 brought the target range for the federal funds rate to 2.25%-2.5%. After the policy rate had been raised a few times, the FOMC decided to begin reducing the size of the balance sheet, as announced in September 2017. The balance sheet normalization program began the next month, in October 2017.
XBI was up ~140% over the last “tightening cycle” (2016-2018) following a similar ~50% drawdown in 2015 like we just saw in 2021…
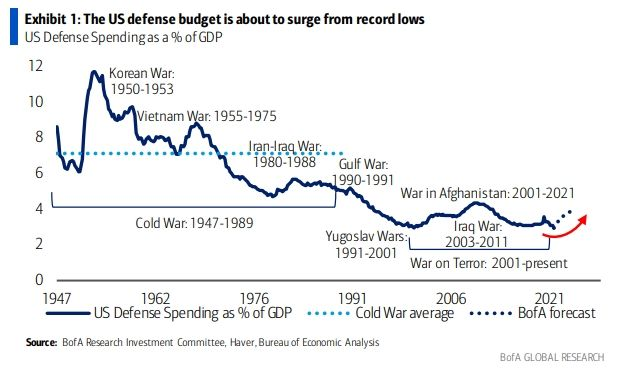
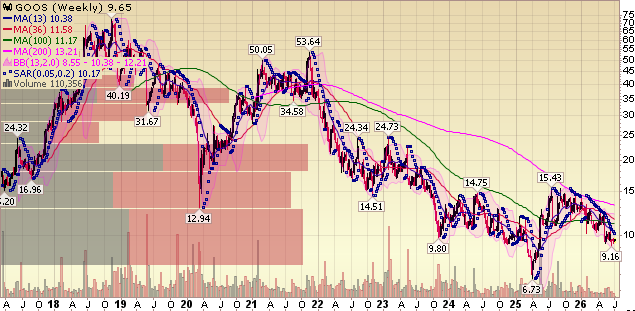
For those wondering if Defense stocks will persist in their recent strength (as we anticipated in Fall 2021), here is the chart I referenced in last week’s podcast|videocast. Expect more spending on defense in coming years. Couple it with providers that also make/service airplane engines for the travel recovery and you can’t miss:
Now onto the shorter term view for the General Market:
In this week’s AAII Sentiment Survey result, Bullish Percent (Video Explanation) came in at AAII Sentiment Survey Results (Click Thursday Morning) this week from 31.9% last week. Bearish Percent came in at AAII Sentiment Survey Results (Click Thursday Morning) from 27.5% last week.
__________________________________
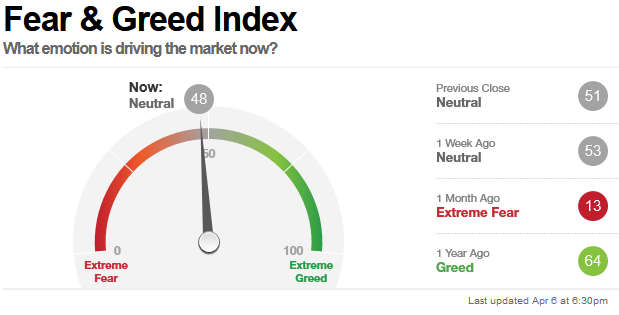
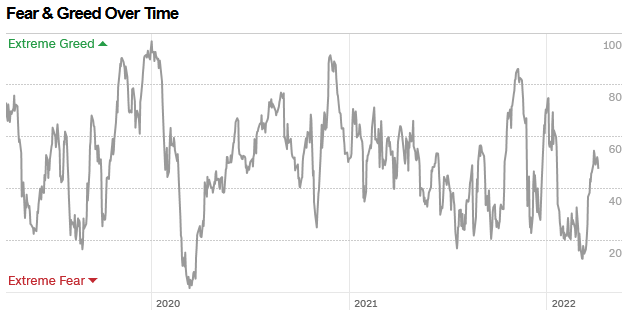
The CNN “Fear and Greed” Index ticked down from 51 last week to 48 this week. Sentiment is still cautious in the market. You can learn how this indicator is calculated and how it works here: (Video Explanation)
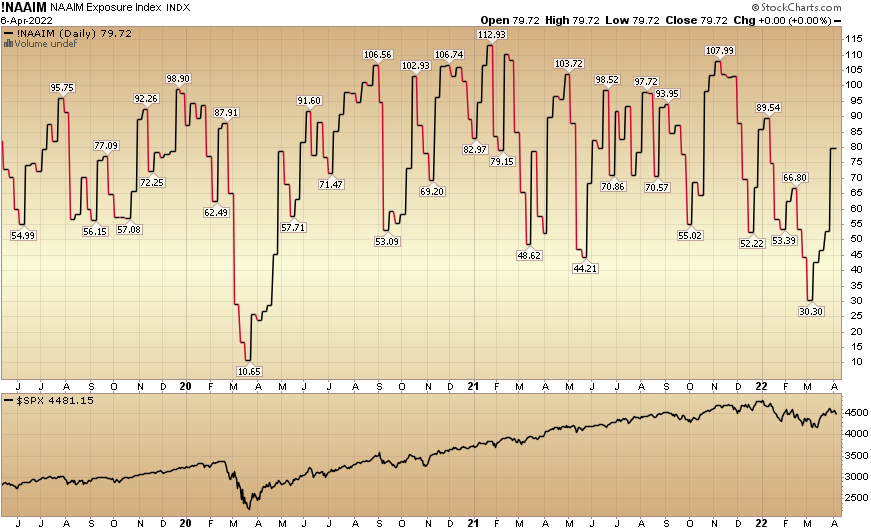
And finally, this week the NAAIM (National Association of Active Investment Managers Index) (Video Explanation) moved up to 79.72% this week from 52.69% equity exposure last week. Managers will have to chase further strength in the coming weeks.
Our podcast podcast|videocast will be out on Friday this week. Each week, we have a segment called “Ask Me Anything (AMA)” where we answer questions sent in by our audience. If you have a question for this week’s episode, please send it in at the contact form here.

Comments
Log in or sign up to join the conversation.