
Technical Market Report For June 14, 2025
The good news is:
- Friday the 13th is over.
The Negatives
The first chart covers the last 6 months showing the S&P 500 (SPX) in red and a 10% trend (19 day EMA) of NYSE new highs (NY NH) in green. Dashed vertical lines have been drawn on the 1st trading day of each month.
NY NH turned downward from its already low level.

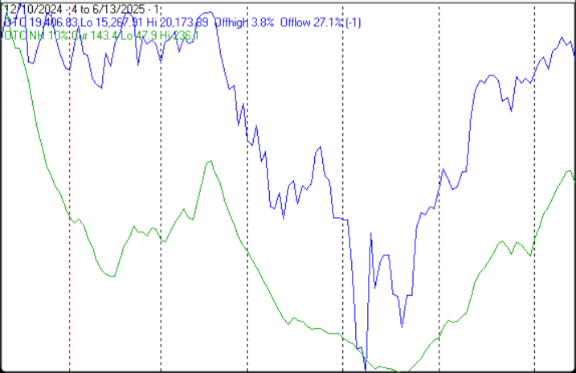
The next chart is similar to the 1st one except it shows the Nasdaq composite (OTC) in blue and OTC NH in green has been calculated with Nasdaq data.
OTC NH also turned downward from an already low level.
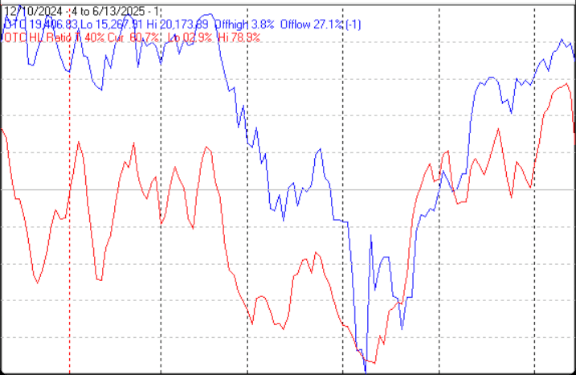
The next chart covers the past 6 months showing the OTC in blue and a 40% trend (4 day EMA) of Nasdaq new highs divided by new highs + new lows (OTC HL Ratio), in red. Dashed horizontal lines have been drawn at 10% levels for the indicator; the line is solid at the 50%, neutral level (equal numbers of new highs and new lows).
OTC HL Ratio turned sharply downward.
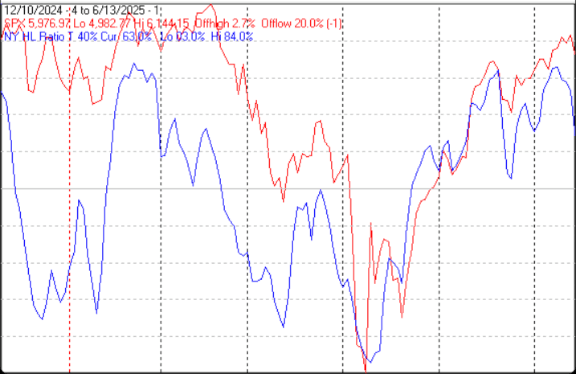
The next chart is similar to the one above except it shows the SPX in red and NY HL ratio, in blue, has been calculated with NYSE data.
NY HLR also turned sharply downward.
The next chart covers the past 6 months showing the SPX in red and a 10% trend (19 day EMA) of NYSE new lows (NY NL) in blue. NY NL has been plotted on an inverted Y axis so decreasing numbers of new lows move the indicator upward (up is good).
NY NL; on Friday NYSE new lows more than doubled from Thursday.
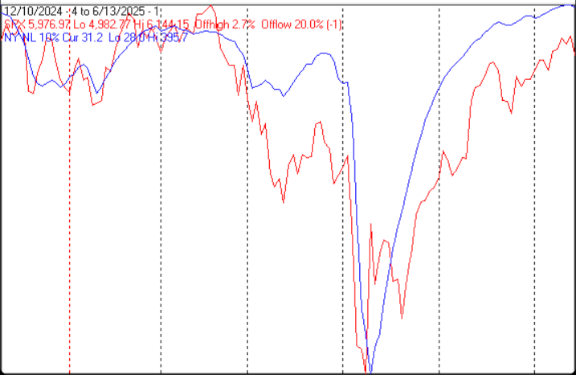
The next chart is similar to the one above except it shows the OTC in blue and OTC NL, in brown, has been calculated with Nasdaq data.
OTC NL; Nasdaq new lows also, more than doubled, from Thursday to Friday.

The Positives
Friday may have been a pivotal day. Everything turned sharply downward.
Seasonality
Next week includes the 4 trading days prior to the 3rd Friday of June during the 1st year of the Presidential Cycle. The tables below show the daily change, on a percentage basis, for that period. The Market will be closed on Thursday June 19 in observance of the Juneteenth holiday.
OTC data covers the period from 1963 to 2024 while SPX data runs from 1953 to 2024. There are summaries for both the 1st year of the Presidential Cycle and all years combined. Prior to 1953 the market traded 6 days a week, so that data has been ignored.
Seasonality for next week has been mixed and much weaker during the 1 year of the Presidential Cycle than other years.
Report for the week before the 3rd Friday of June.
The number following the year is the position in the Presidential Cycle.
Daily returns from Monday through 3rd Friday.
OTC Presidential Year 1 (PY1)
Year Mon Tue Wed Thur Fri Totals
1965-1 0.38% -1.96% 1.05% 0.72% 0.65% 0.85%
1969-1 -0.11% -0.65% -0.86% -0.70% -0.60% -2.91%
1973-1 -0.66% 1.70% -0.44% -0.74% -1.26% -1.39%
1977-1 0.22% 0.43% -0.03% 0.56% 0.40% 1.58%
1981-1 0.09% -1.07% 0.01% -0.86% 0.39% -1.44%
Avg -0.01% -0.31% -0.05% -0.20% -0.08% -0.66%
1985-1 -0.20% 0.19% 0.08% -0.27% 0.47% 0.27%
1989-1 -0.06% -0.59% -0.02% -0.79% 0.02% -1.42%
1993-1 0.46% 0.13% -0.16% -0.04% -0.91% -0.52%
1997-1 0.63% 0.78% -0.74% 1.03% 0.00% 1.69%
2001-1 -2.00% -0.04% -2.23% -3.66% -0.77% -8.69%
Avg -0.23% 0.09% -0.61% -0.75% -0.30% -1.73%
2005-1 0.29% 0.00% 0.28% 0.69% 0.05% 1.31%
2009-1 -2.28% -1.11% 0.66% -0.02% 1.09% -1.66%
2013-1 0.83% 0.87% -1.12% -2.28% -0.22% -1.92%
2017-1 -0.52% 0.73% -0.41% 0.00% -0.22% -0.43%
2021-1 0.74% -0.71% -0.24% 0.87% -0.92% -0.26%
Avg -0.19% -0.05% -0.16% -0.19% -0.05% -0.59%
OTC summary for PY1 1965 - 2021
Avg -0.14% -0.09% -0.28% -0.39% -0.13% -1.00%
Win% 53% 53% 33% 36% 50% 33%
OTC summary for all years 1963 - 2024
Avg -0.16% 0.19% 0.06% -0.04% -0.02% 0.01%
Win% 47% 63% 62% 50% 52% 53%
SPX PY1
Year Mon Tue Wed Thur Fri Totals
1953-1 -0.84% -0.30% 1.27% -0.04% 0.00% 0.10%
1957-1 0.19% -0.41% -0.67% -0.61% -0.59% -2.09%
1961-1 -0.77% -0.53% 0.27% -0.44% -0.78% -2.24%
1965-1 -1.30% 0.57% 0.84% 0.63% -0.47% 0.27%
1969-1 -0.33% -0.38% -0.14% -0.58% -0.59% -2.02%
1973-1 -0.31% 1.49% -0.64% -1.12% -1.22% -1.79%
1977-1 0.28% 1.13% -0.25% 0.24% 0.12% 1.53%
1981-1 0.09% -1.09% 0.89% -1.26% 0.48% -0.90%
Avg -0.31% 0.35% 0.14% -0.42% -0.34% -0.58%
1985-1 -0.30% 0.43% -0.38% 0.05% 1.54% 1.35%
1989-1 -0.14% -0.71% -0.02% -1.16% 0.40% -1.64%
1993-1 0.10% -0.32% 0.26% 0.25% -1.08% -0.80%
1997-1 0.07% 0.06% -0.59% 1.00% 0.08% 0.61%
2001-1 -0.84% 0.12% -1.13% -1.75% -0.45% -4.06%
Avg -0.22% -0.08% -0.37% -0.32% 0.10% -0.91%
2005-1 0.23% 0.26% 0.22% 0.36% 0.50% 1.56%
2009-1 -2.38% -1.27% -0.14% 0.84% 0.31% -2.63%
2013-1 0.76% 0.78% -1.39% -2.50% 0.27% -2.08%
2017-1 -0.10% 0.45% -0.10% -0.21% 0.03% 0.07%
2021-1 0.18% -0.20% -0.54% -0.04% -1.31% -1.91%
Avg -0.26% 0.00% -0.39% -0.31% -0.04% -1.00%
SPX summary for PY1 1953 - 2021
Avg -0.30% 0.00% -0.12% -0.35% -0.16% -0.93%
Win% 44% 50% 33% 39% 53% 39%
SPX summary for all years 1953 - 2024
Avg -0.09% 0.19% 0.00% -0.14% -0.04% -0.08%
Win% 58% 58% 47% 49% 54% 56%
Money supply (M2) and Interest Rates
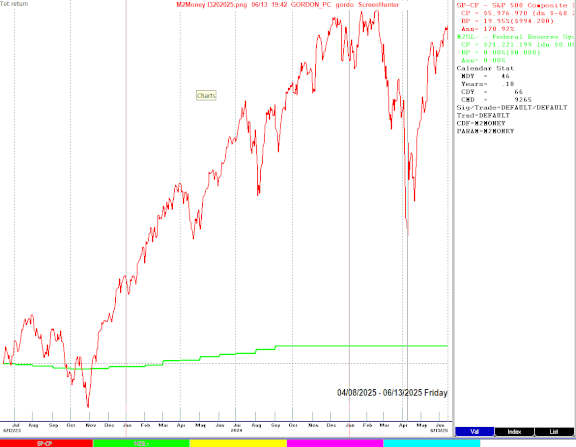
The following chart was supplied by Gordon Harms.
The chart, was made with FastTrack, covers the past 2 years showing the SPX in red and M2 money supply in green.
Money supply has remained constant for several months.
Treasury rates at their close last Friday and their changes from 2 months ago:
2yr yield 3.958% down from 4.014%
5yr yield 4.010% down from 4.092%
10yr yield 4.406% down from 4.484%
30yr yield 4.903% down from 4.954%
The following chart covers the past year showing the yield of the 30 year bond in red, 20 year in green, 10 year in yellow, 5 year in purple, 2year in cyan and the 1 year in white.

Conclusion
Traders do not appear to be happy about the new war.
Seasonality for next week is the worst we have seen in a while.
The strongest sectors last week were Energy and Precious Metals while the weakest were Banks and Transportation.
I expect the major averages to be lower on Friday June 20 than they were on Friday June 13
Last week's positive forecast was a miss.
More By This Author:
Technical Market Report For June 7, 2025Technical Market Report For May 31, 2025
Technical Market Report For May 24, 2025


