
Technical Analysis For S&P 500, Gold, Silver, Platinum, Uranium, And Uranium Miners

Image Source: Unsplash
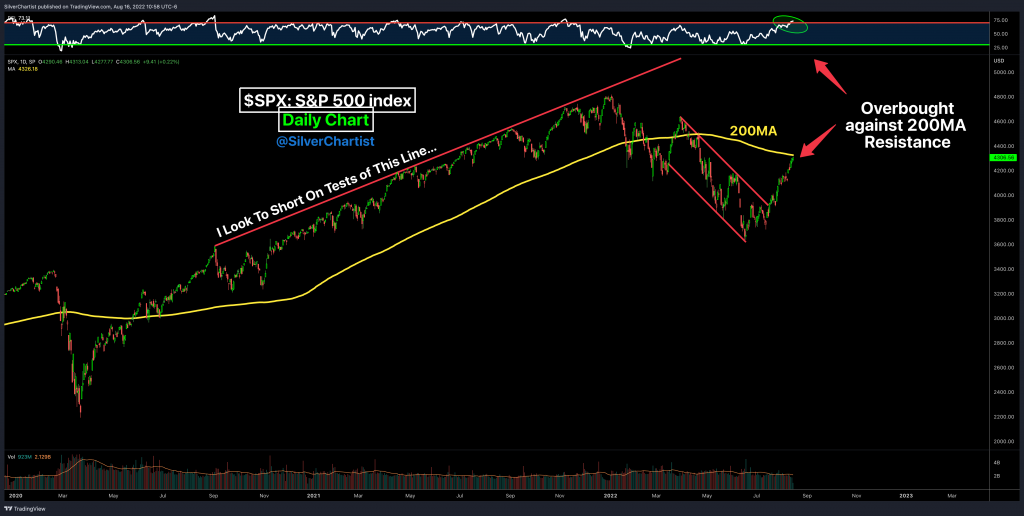
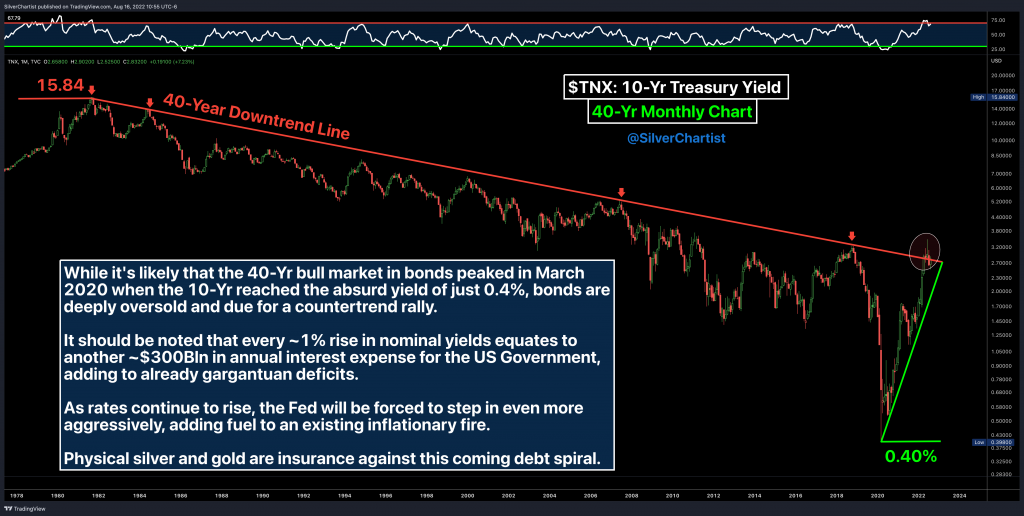
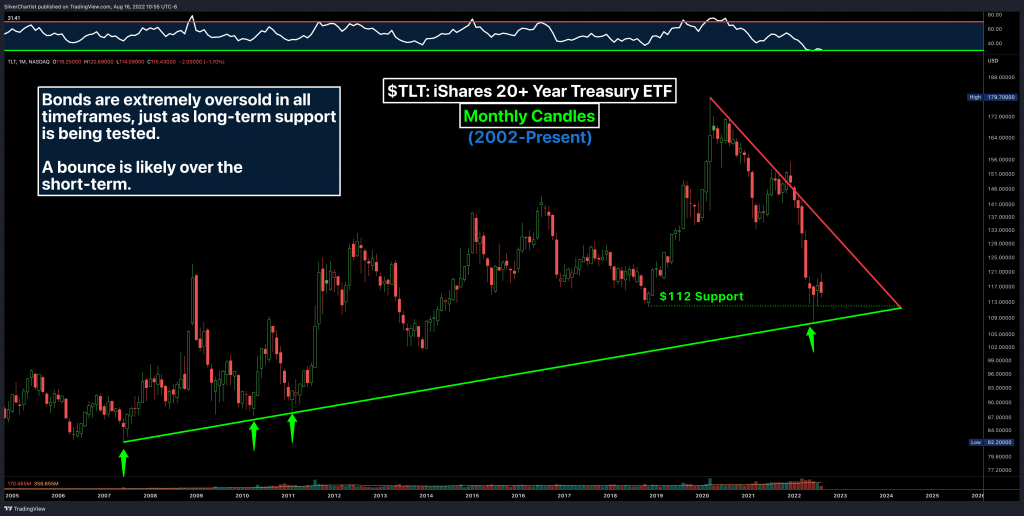
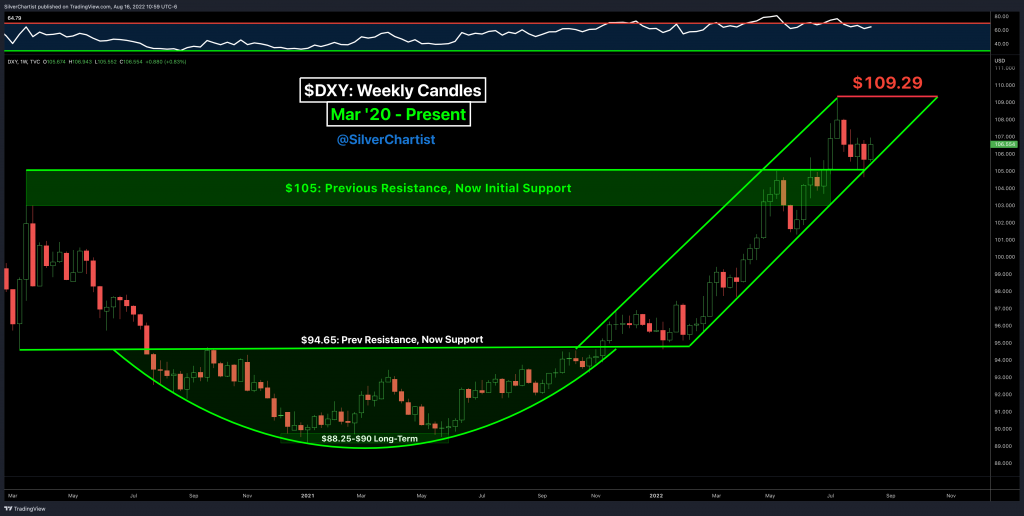
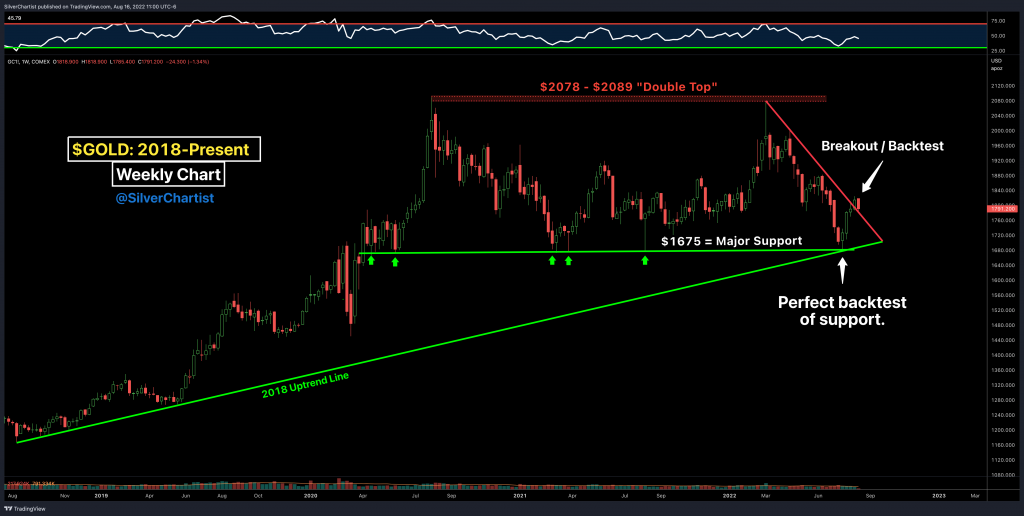
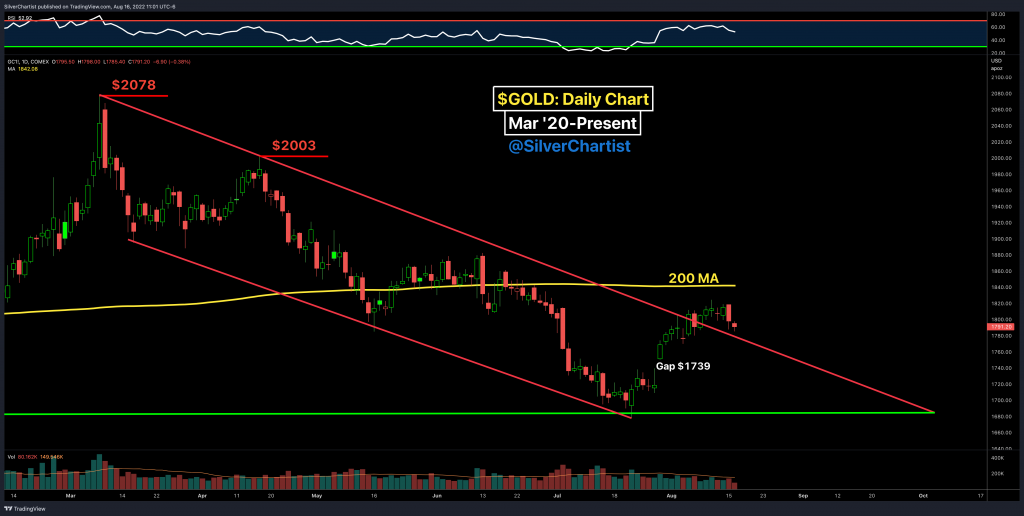
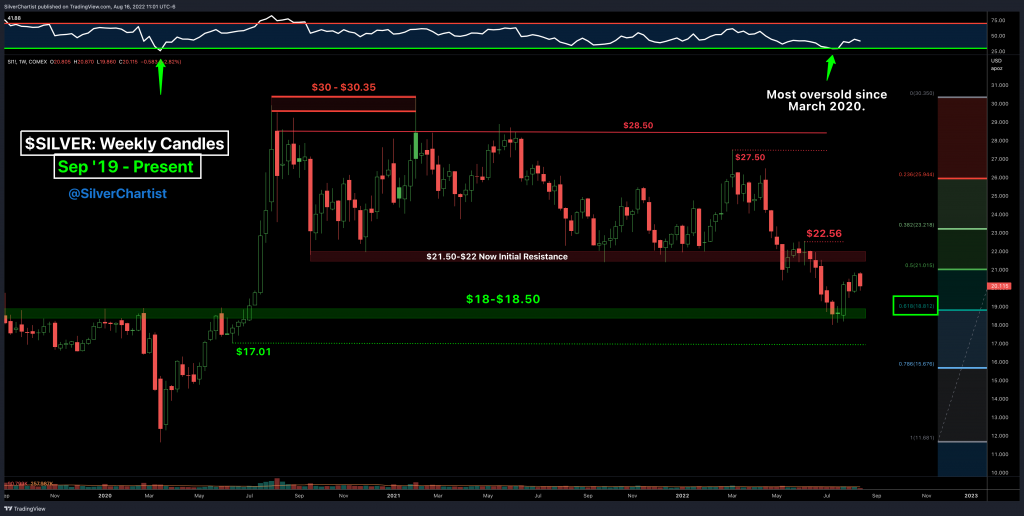
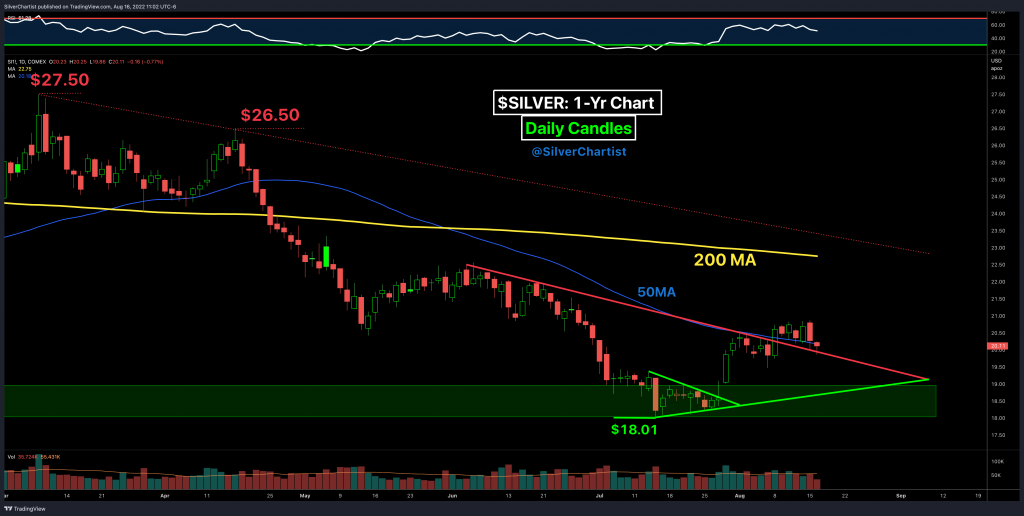
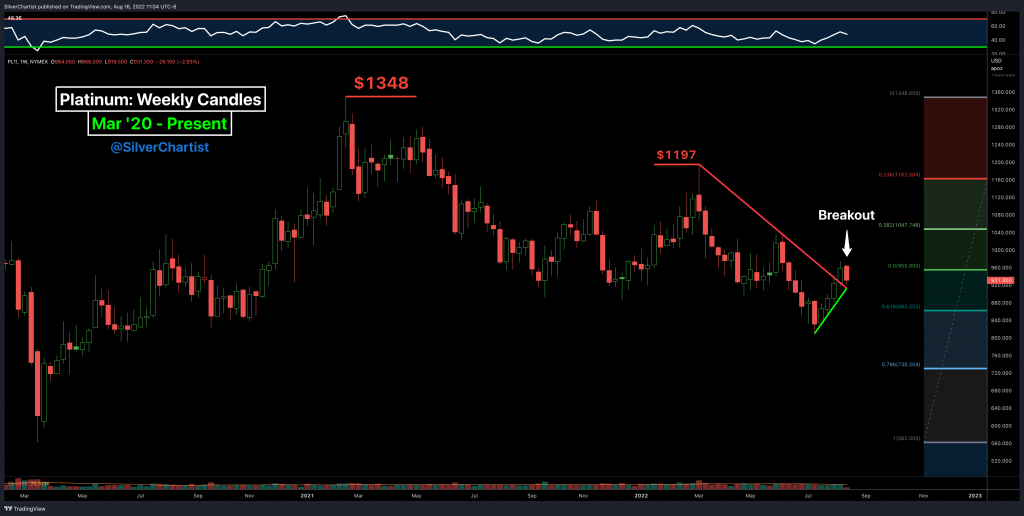
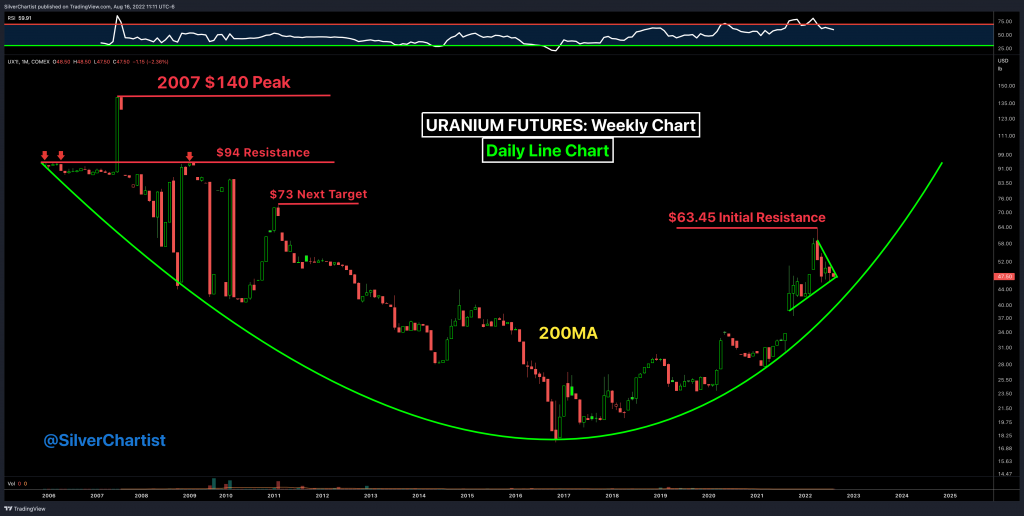
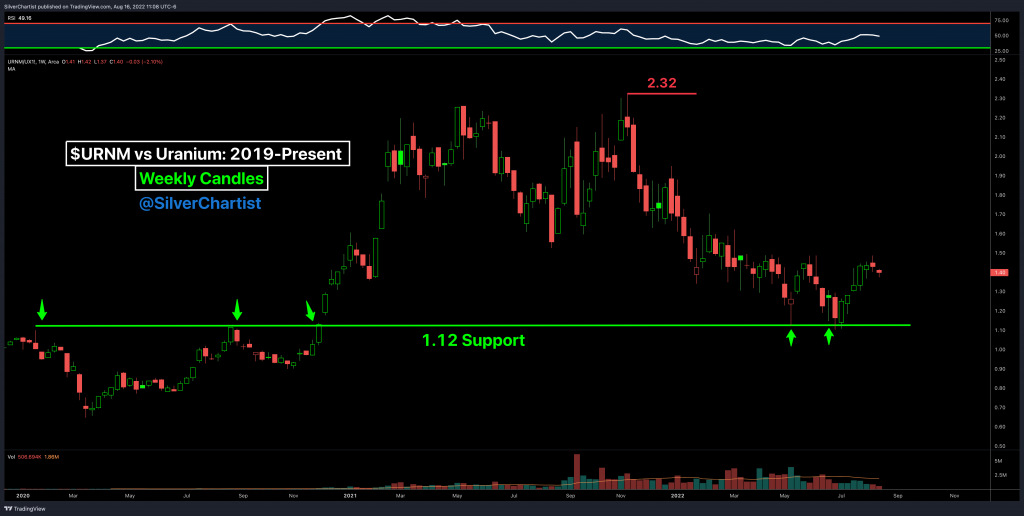
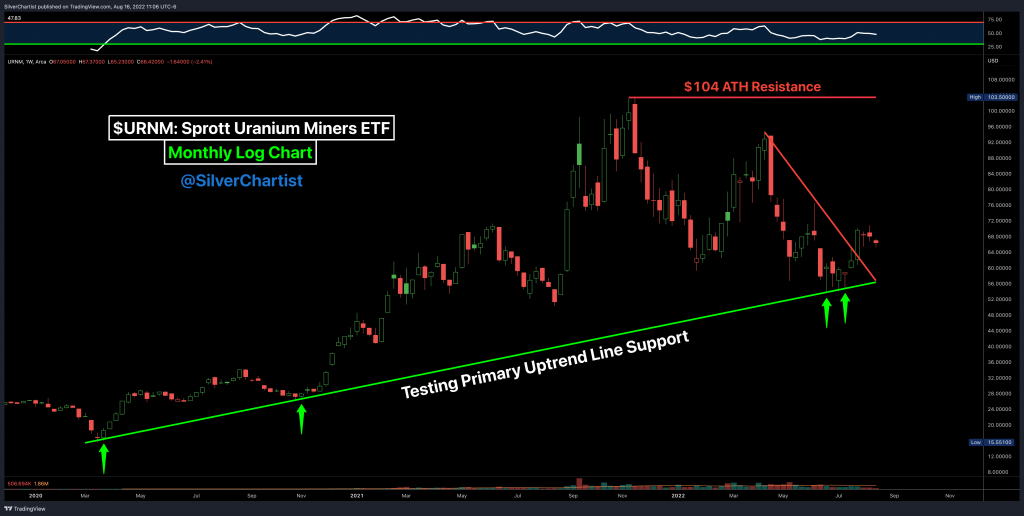
Steve Penny, Publisher of The SilverChartist Report, joins us to share a number of key charts on the S&P 500 (SPX), (TNX) for 10 year US treasury yields, (TLT) reflecting long-dated bonds, (DXY) US Dollar Index, Gold weekly and daily, Silver weekly and daily, Platinum weekly, Uranium ratio chart, and a monthly chart of (URNM) Sprott Uranium Miners ETF. {all charts are posted below so you can follow along}
We intermix some macro fundamental discussion in around these various markets to get an overall take on where the drivers of each sector will come from, in relation to price movements.
Audio Length: 00:19:27
(Click on image to enlarge)
(Click on image to enlarge)
(Click on image to enlarge)
(Click on image to enlarge)
(Click on image to enlarge)
(Click on image to enlarge)
(Click on image to enlarge)
(Click on image to enlarge)
(Click on image to enlarge)
(Click on image to enlarge)
(Click on image to enlarge)
(Click on image to enlarge)
More By This Author:
A Focus on US Market Health, New Fed Nominees, and Base Metal InvestmentsA Closer Look At The Reversal In Gold And Gold Stocks
This Year Is Looking A Lot Like 2010 For The Precious Metals
Disclosure: None.


