
S&P 500 Lower In Early NY Trade, Bonds Bid Near Key Levels
Overseas markets were lower overnight on the chatter of Covid variants and the ECB. The S&P 500 is lower by over 60 handles in early NY cash trading.
US equity futures were lower overnight ahead of the cash open with several headlines moving the market; the ECB confirms that they are raising their inflation goal to 2%, there is talk of Covid variants, and a potential spectator-free Olympic games. It is one of those mornings. To put matters into perspective, let’s take a look at a daily candlestick chart of the S&P 500.
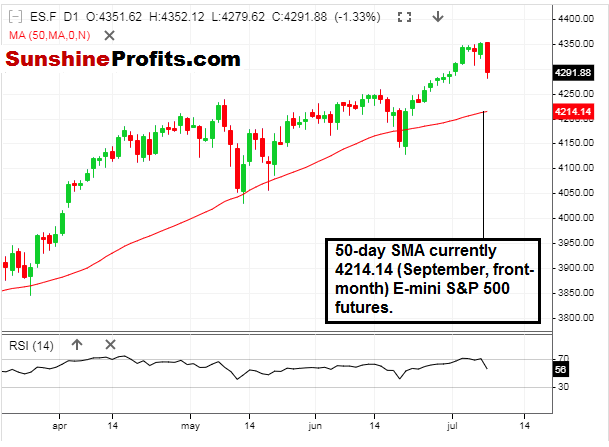
Figure 1 - E-Mini S&P 500 Futures March 13, 2021 - July 7, 2021, 8:42 AM, Daily Candles Source stooq.com
After the slow grind higher, we finally have a meaningful pullback so far at the open today. It was hard to see that one coming, and we will find out if the pullback has any legs to it throughout the day. The 50-day SMA is still quite a distance away (4214.14), so I would not be in any rush to buy the index here, and also don’t see any reason to get emotional and sell into it, either.
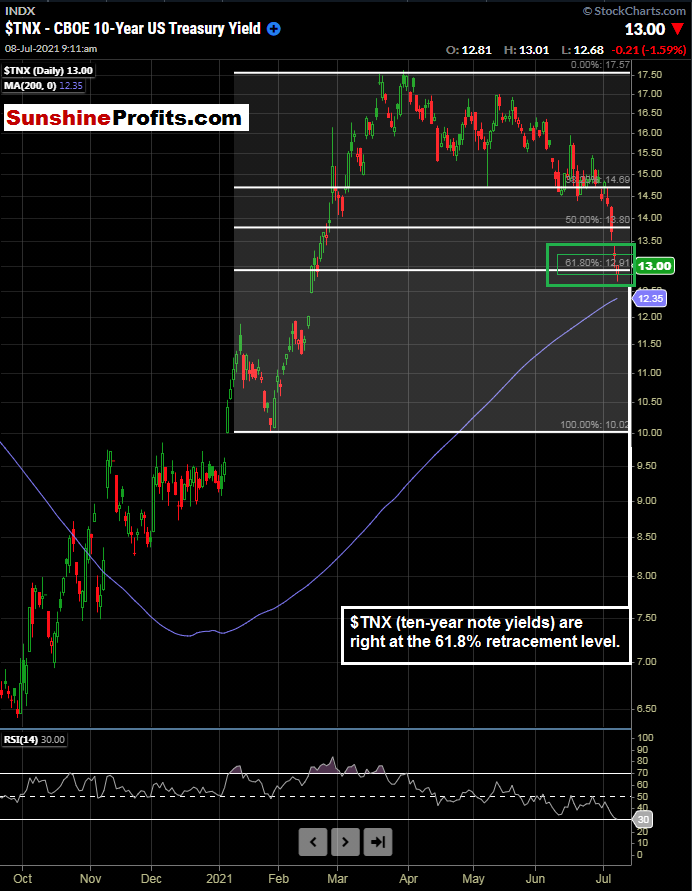
Figure 2 - Ten-Year Treasury Note Yield September 16, 2020 - July 7, 2021, 9:04 AM, Daily Candles Source stockcharts.com
It is a somewhat rough open today, with capital fleeing into Bonds (even further) and the S&P 500 opening down ~1.4%. Is rushing into buying bonds (expecting lower yields) the right thing to do right now?
I don’t think so. Taking all of the emotion out of the market, the 10-year note yields are in oversold daily territory and hitting a 61.8% retracement level, with the 200-day moving average in sight.
Yesterday, the ten-year yield gapped lower and looked like it was putting in a low, with a doji candle formation after gapping down on the session. As it turns out, today may be an even more favorable day to consider getting long interest rates in one shape, form, or fashion.
Speaking of bond yields, we examined them yesterday, and they are indeed lower again this morning. We looked at TLT, and let's take a look early this morning.
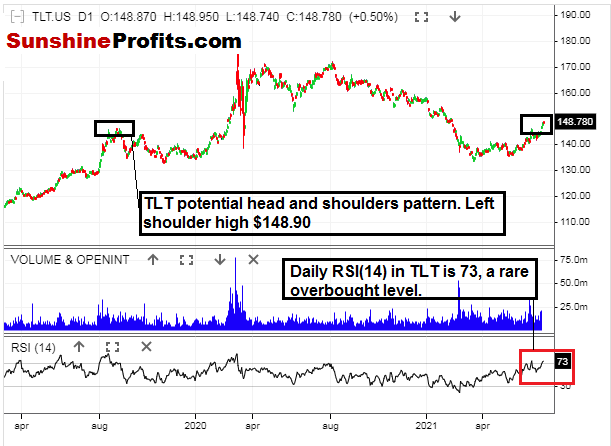
Figure 3 - TLT iShares 20+ Year Bond ETF September 10, 2018 - July 7, 2021, DailyCandles Source stooq.com
This potential head and shoulders (long-term) formation in TLT has a left shoulder high of $148.90. We are currently trading higher than this as I write this, at $149.24. It is up by 0.83% on the day so far. It is not the biggest up day in the world, but not too much fun when short from $148.00.
Emotions and trading do not mix. Today, all of the talking heads are making it sound like the sky is falling with capital moving out of stocks and into bonds. The SPX was up for eight of the last nine sessions, I believe, and the index is currently trading where it was last Monday. Is that really a big deal? That is why I love to consult the charts and technicals; there is no human emotion in there.
Another key observation: The Ten-Year note yield has not had a daily RSI(14) level this low (29) since the Covid-19 meltdown. Oversold much?
Disclaimer: This content is for informational and analytical purposes only. All essays, research, and information found above represent analyses and opinions of Rafael Zorabedian, and Sunshine ...
more

