Seeking Shelter In Short-Term Municipals
As has been the case for most of 2023, markets continue to grapple with the notion of whether the Fed will maintain its plan of “higher for longer.” Last week’s release of strong economic data (improved GDP expectations and strong unemployment) exacerbated selling in longer-dated treasuries, sending yields higher. As a result, U.S. Treasury bonds are on track to have their third consecutive year of negative performance—something that has never happened in the 95-year history of U.S. government securities.
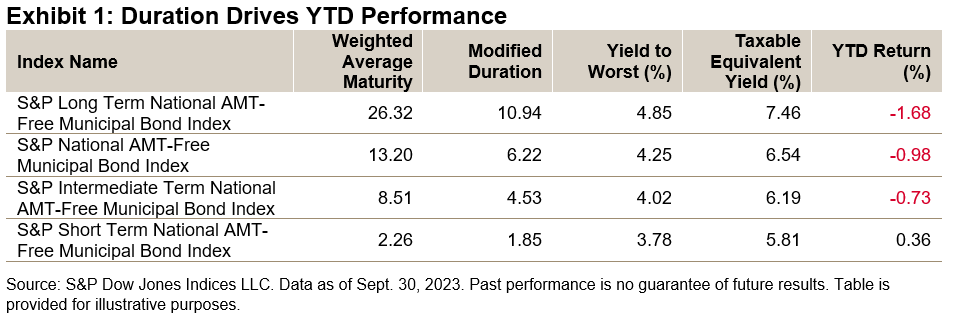
The municipal bond market has faced additional challenges as both rising rates and poor technicals have resulted in a double whammy for most investors looking for tax-exempt income. Lipper has reported outflows from municipal funds in four of the last six months. Lower demand has added further price pressure on municipal bonds, especially in the 7- to 10-year range. However, there is a bright spot at the “front of the curve.” The S&P Short Term National AMT-Free Municipal Bond Index is the only member of the S&P AMT-Free Municipal Bond series that has managed to remain in positive territory through the first three quarters of 2023 (see Exhibit 1).
(Click on image to enlarge)

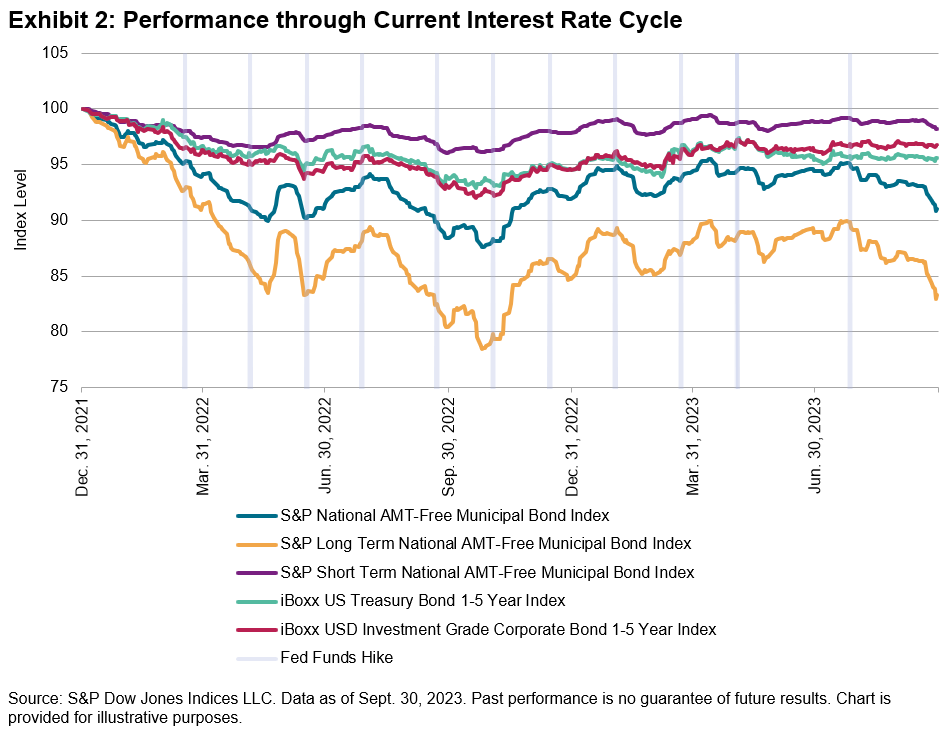
As expected, short-duration investments have outperformed during the current interest rate cycle, which began back in March 2022. Since that time, the Federal Open Market Committee (FOMC) has increased the fed funds rate 11 times for a total of 525 bps. Long-duration bonds have felt the brunt of these increases, with the S&P Long Term National AMT-Free Municipal Index experiencing a drawdown of over 20% (still faring much better than the S&P U.S. Treasury Bond 20+ year Index’s 40% drawdown). Meanwhile, the max drawdown of the S&P Short Term National AMT-Free Municipal Bond Index never exceeded 4% (see Exhibit 2).
(Click on image to enlarge)

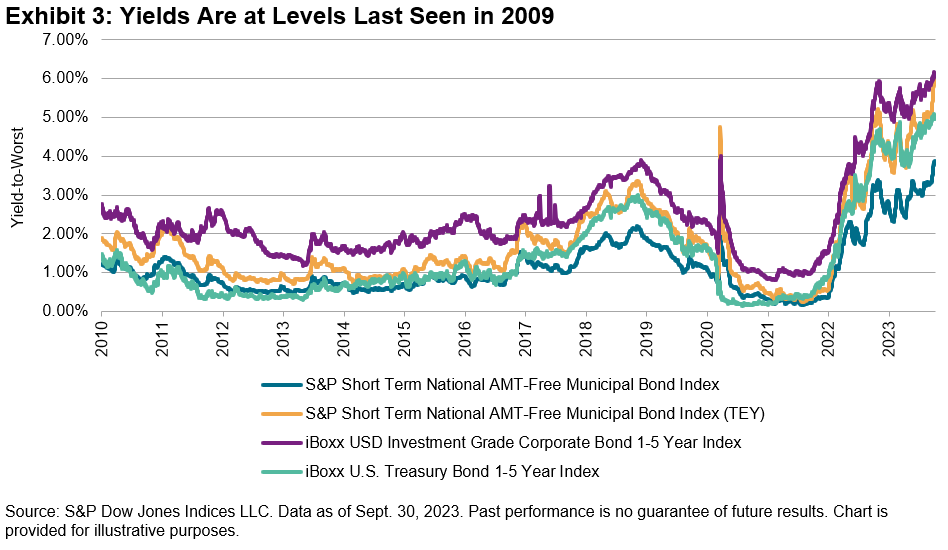
The silver lining, perhaps, is that yields across nearly all sectors and maturities are at or near 15-year highs. Yields on the S&P Short Term National AMT-Free Municipal Bond Index crossed 3% in August and sat at 3.83% as of Sept. 30, 2023, 200 bps above the previous year. Furthermore, the taxable equivalent yield is closing in on 6%; 95 bps higher than similar maturity treasury notes and only 15 bps lower than short-term investment grade corporates (see Exhibit 3).
(Click on image to enlarge)

However, higher yields beget increased interest expense for issuers. Interest expense and interest coverage ratios are significant drivers of credit ratings and when it comes to credit quality, not all investment grade sectors are the same. Using the S&P National AMT-Free Municipal Bond Index as a proxy, more than 72% of the investment grade municipal market is rated AA- or higher while less than 10% is rated BBB+ or worse. Conversely, as measured by the iBoxx USD Investment Grade Corporate Bond Index, only 8% of the investment grade corporate market is rated AA- or higher while more than half (53%) is rated BBB+ or worse.
(Click on image to enlarge)

Many fixed income investors may view this period as an opportunity to take advantage of higher yields with an expectation of a Fed pivot in the near future. But if inflation remains stubborn and the Fed is forced to maintain a “higher for longer” monetary policy, short-term municipals’ historic ability to offer relatively high taxable-equivalent yields, high credit quality and lower sensitivity to potential tightening may make them an option worth considering.
More By This Author:
Why Do U.S. Mid-Cap Equities Matter?Active Success: Still Elusive
Exploring Dividends Down Under
Disclaimer: See the full disclaimer for S&P Dow Jones Indices here.


