
Q1 2019 EPS Forecast Take A Hit While S&P 500 Surges Through January 2019: Sustainable?
This has been one heck of a market rally, but it comes on the heels of one heck of a market drop late in 2018. And that’s the context we have to define and work with as we review the current state of the market and what drives it going forward. From a pure statistical standpoint, let’s review the following for the S&P 500 (SPX):
- Up 5 of the past 6 weeks
- Up more than 10%
- Still under 200-DMA
With the S&P 500 now having retraced 60% of its Q4 2018 decline, many traders/investors are doubting whether or not the S&P will pullback or retest the December 2018 lows. Nonetheless, just like markets don’t go down in a straight line, they tend to not go up in a straight line either. With the S&P 500 in between two key gravity points at 2,731 and 2,682, we still anticipate some degree of a market pullback in the near future. Given the bullet points noted above regarding the S&P 500, let’s look at those key statistics we need to point out regarding the probability of a pullback.
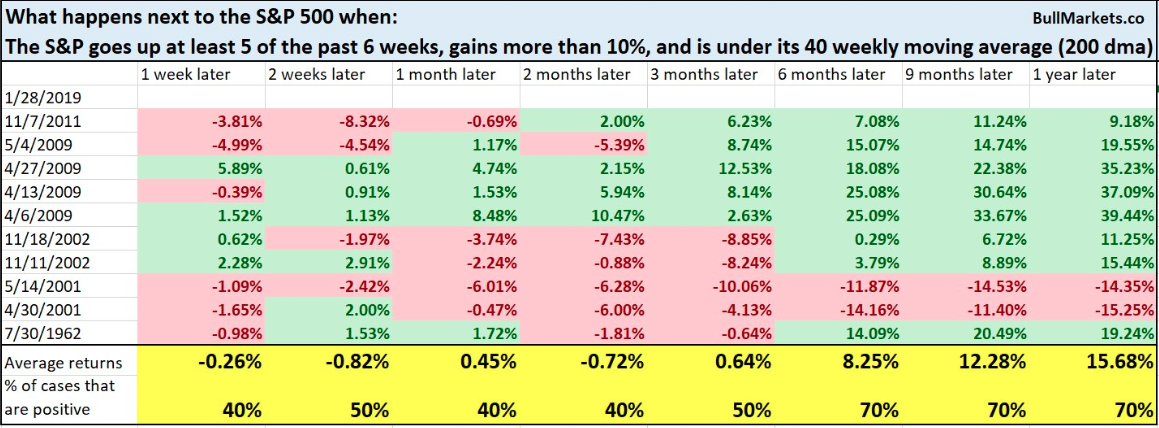
As depicted in the table above, we can see that the current state of the market/SPX suggests that over the next two weeks, at least, the market has historically delivered negative returns. To be fair, historically the conditions didn’t bear out a huge pullback during that time period and also look at the market 12 months later. That’s a pretty strong rally that we may witness if history is any guide. As it pertains to the statistical data represented in the table provided, could the current rally actually produce a V-shaped rally that leads to near, new highs and without a significant pullback before doing so? Again, in order to answer this question, we look toward history for context.
It is not impossible for the S&P 500 to rally to almost a new all-time high before making a pullback/retest. This happened in 1957, and to a lesser extent in 2015-2016. So could the forecast for a pullback be proven wrong, yes! But the probability of it being wrong is very low and that is all we are trying to demonstrate with the table above. Given the data at-hand, what may prove most important is the long-term data that suggests a strong market performance over a 12-month period. As such, playing the “market timing” game where one attempts to actively position for pullbacks and surges has a 50-50 chance of proving more beneficial than passive long-term positioning. With that, let’s take a quick look at last week’s daily market moves and where the week finished out.
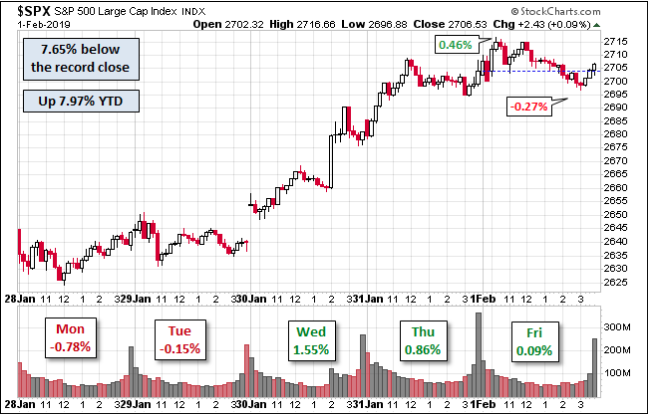
The S&P 500 was up 2.37% from last Friday and is up 7.97% YTD. Much of what was lost in the Q4 2018 period has since been recovered, but the index remains roughly 8% from its all-time highs. Until a new all-time high is achieved, the S&P 500 remains in a downtrend within a corrective period.
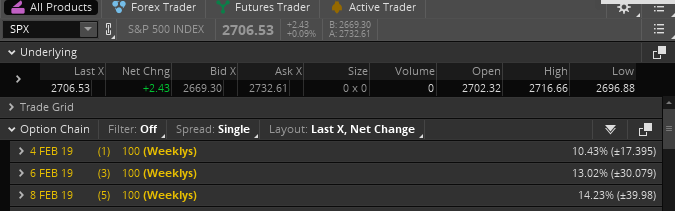
Last week the options market was pricing in a SPX weekly move of $47/points. On Friday, we saw the market move right up to and breach the weekly expected move as options expired and then pull right back inside of the weekly expected move. Efficient markets folks; efficient markets… at least for now.
I’ve outlined in the past that as market volatility/VIX is reigned in, the weekly expected moves also tend to decrease in size. With the VIX falling below its 200-DMA for the first time since last October (16.14 at Friday’s close), we see that we’ve gone from a $47/point weekly expected move for the S&P 500 to nearly a $40/point weekly expected move this coming week. In short, the week ahead is expected to express less volatility.
Why We Are Here: The Macro
In contemplating and forecasting the market we have to reflect further on the market rally and why it has come to pass. The depths of the Q4 2018 correction came about, largely due to global economic policy uncertainty and how such policies might impact corporate earnings growth. Absent such concerns or uncertainty, U.S. corporate fundamentals were performing at record levels, but found with some setbacks due to slowing in China’s economic activity. Unfortunately, some of this slowdown in the Chinese economy was due to policy uncertainty related to trade with the United States. Ultimately, global economic policy uncertainty elevated to a record level and morphed out of control in Q4 2018 as liquidity was drained from equity markets.
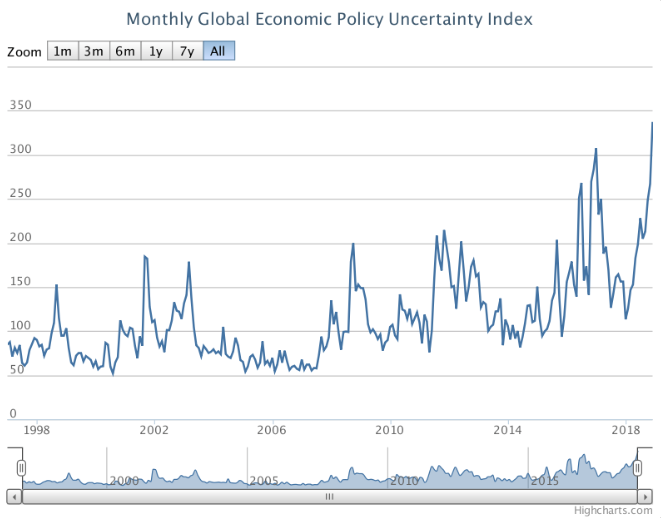
I’ve depicted, in the past, much of the macro-uncertainty around the world was manmade. Be it Brexit uncertainty, trade conflicts or central bank policies, most all that ailed economic conditions that filtered down to global equity markets had been manmade crises. Some of these uncertainties have since found some semblance of resolution or resolution is on the horizon.
In the latest State Of The Market video by Finom Group (for whom I am employed), I go into great detail on how central banks are now presenting a more accommodative stance to economies and markets. While Brexit still demands a comprehensive resolution by late March, China/U.S. trade resolution has a March 1 deadline before additional tariffs go are slated for implementation. Last week, meetings between the two parties kicked into high gear with high-level delegates from both sides participating in what aims to be the precursor to finalizing a trade deal, comprehensive or otherwise.
China’s leader Xi Jinping told U.S. President Donald Trump in a letter that he hopes both sides will be able to meet each other halfway to reach a trade agreement before a March 1 deadline, Trump said on Thursday. Here is a statement from the White House Administration regarding the latest round of trade talks and planning upcoming meetings between the leaders of the two nations.
“January 31, 2019
Statement of the United States Regarding China Talks
For the last two days, high-ranking officials from the United States and China have engaged in intense and productive negotiations over the economic relationship between our two countries. The United States appreciates the preparation, diligence, and professionalism shown throughout these meetings by Vice Premier Liu He and his team.
The talks covered a wide range of issues, including: (1) the ways in which United States companies are pressured to transfer technology to Chinese companies; (2) the need for stronger protection and enforcement of intellectual property rights in China; (3) the numerous tariff and non-tariff barriers faced by United States companies in China; (4) the harm resulting from China’s cyber-theft of United States commercial property; (5) how market-distorting forces, including subsidies and state-owned enterprises, can lead to excess capacity; (6) the need to remove market barriers and tariffs that limit United States sales of manufactured goods, services, and agriculture to China; and (7) the role of currencies in the United States–China trading relationship. The two sides also discussed the need to reduce the enormous and growing trade deficit that the United States has with China. The purchase of United States products by China from our farmers, ranchers, manufacturers, and businesses is a critical part of the negotiations.
The two sides showed a helpful willingness to engage on all major issues, and the negotiating sessions featured productive and technical discussions on how to resolve our differences. The United States is particularly focused on reaching meaningful commitments on structural issues and deficit reduction. Both parties have agreed that any resolution will be fully enforceable.
While progress has been made, much work remains to be done. President Donald J. Trump has reiterated that the 90-day process agreed to in Buenos Aires represents a hard deadline, and that United States tariffs will increase unless the United States and China reach a satisfactory outcome by March 1, 2019. The United States looks forward to further talks with China on these vital topics.”
In earnest and what is widely expected from the U.S./China trade feud is that both sides will offer concessions or accommodations to reach a trade deal. Like the revised USMTA agreement, the new trade deal between the U.S. and China will likely not prove a grand deal, but something that allows both sides to walk away with improved trade, more “checks & balances”, greater cooperation and the ability to say they won something in the deal. This is enough to bring about greater certainty surrounding the global economic policy sentiment and improve regional business sentiment. But, yes there is always a but!
Another issue is lingering that has received little investor or financial media attention of late. Much of what we’ve been forced to accept as investors is that the geo and domestic political strife that had birthed in 2018 has also affected economic conditions and global equity markets. Given the aforementioned, we remain at a heightened state of political uncertainty until we are met with resolution on the U.S./China trade front. While many investors are focused on the U.S./China trade negotiations, many have forgotten the now 9-month long review from the USTR on auto trade between the U.S. and the European Union. The Commerce Department is expected to release its auto tariff recommendations in mid-February. The EU has refused to include agriculture for US-EU trade negotiations, which is raising the prospect that Trump may pull the trigger on auto tariffs. Once this issue becomes more present and publicly outlined, the warning bells for investors will once again sound.
“I’m hopeful China will be out of the way. The only thing that worries me and it’s going to stretch out for a long time is the risk of putting tariffs on European car exports to this country. That’s going to drag on forever,” Chris Rupkey, chief financial economist at MUFG said.”
With regards to the market and the question as to why are we here, some 8% from the all-time highs, the macro picture remains muddied. It’s hard to foresee an extended period of market calm and certainty given past precedence that seems to find the macro picture moving from one upheaval or crises to the next and in perpetuity. If or when a U.S./China trade deal is surmised and solidified, we may simply find the market contending with a new or newer hurdle… and all this without even discussing the possibility of another U.S. government shutdown and debt limit on the horizon.
Earnings Picture
Even if proving a mixed bag of earnings so far this earnings season, by and large the numbers are better than expected or feared. Let’s firstly take a look at what Thomson Reuters is forecasting and reporting with regards to Q4 2018 earnings season. As of the week ending Feb 1, 2019, nearly 50% of S&P 500 companies have reported results.
S&P 500 Aggregate Estimates and Revisions
- Fourth-quarter earnings are expected to increase 15.5% from Q4 2017. Excluding the energy sector, the earnings growth estimate declines to 12.9%.
- Of the 234 companies in the S&P 500 that have reported earnings to date for Q4 2018, 70.9% have reported earnings above analyst expectations. This is above the long-term average of 64% and below the prior four-quarter average of 78%.
- The Q4 2018 blended revenue growth estimate is 5.7%. Excluding the energy sector, the revenue growth estimate declines to 5.1%.
- 5% of companies have reported Q4 2018 revenue above analyst expectations. This is above the long-term average of 60% and below the prior four-quarter average of 72%.
What we can glean from this latest forecast for earnings during the Q4 2018 period is that results are definitively better than anticipated. Just last week, Reuters was forecasting Q4 2018 earnings to come in at 14.3% and now the forecast has jumped to 15.5 percent. Having said that, the revenue picture has only jumped from 5.6% last week to 5.7% in the revised outlook. The table below from Reuters suggests that Q1 earnings are expected to grow a miniscule .7%, but with each successive quarter showing vast earnings growth improvements.
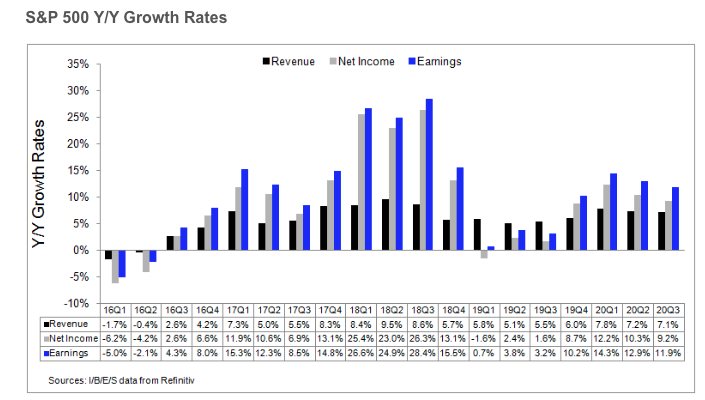
For the Q1 2019 period, it’s important to recognize that Reuters is forecasting -1.6% revenue declines. As nearly 40% of S&P 500 revenues come from overseas, this is partially a forecast that considers the strength of the U.S. Dollar Index (DXY).
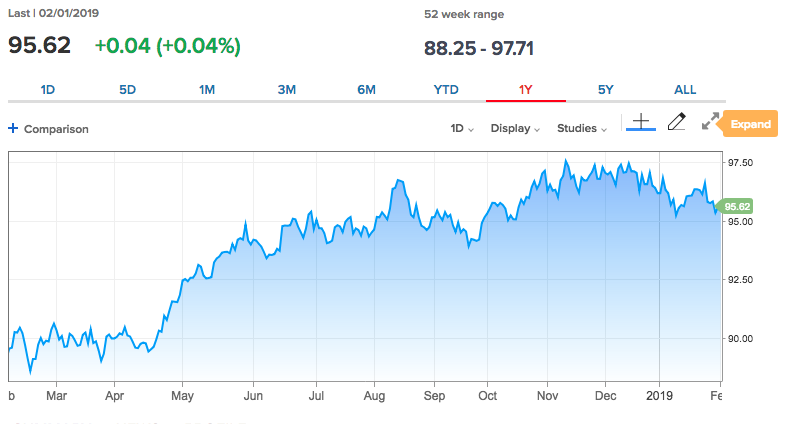
When I review the chart of the U.S. Dollar Index above, we are forced to recognize that we need considerable pressure on the Index to find improvement in the S&P 500 revenue forecast. Most economists are of the opinion that the Index will suffer through the Q1 period and on the whole for 2019, as the FOMC has moved to the sidelines. Goldman Sachs is short the U.S. Dollar Index with a target level of $93 in the near future.
“Bank of America said in its note, “by the end of the year the euro zone and the U.S. will be growing at potential and monetary policies will start converging. U.S. data has already started weakening, after growth peaked in Q2 last year. Euro zone data remains weak, but we believe that the bottom was in Q4 last year. We also expect a U.S.-China trade deal in Q1 this year, which will also be good news for the euro zone economy.
We expect the combination of shifting growth and interest rate differentials - key factors that supported the U.S. dollar in 2018 - to work against it in 2019.” the bank said.”
In 2018, the earnings beat rate was roughly 4.5% per quarter as an aside note and before we take a look at what FactSet is reporting and forecasting for the earnings cycles.
- Earnings Growth: For Q4 2018, the blended earnings growth rate for the S&P 500 is 12.4%. If 12.4% is the actual growth rate for the quarter, it will mark the fifth straight quarter of double-digit earnings growth for the index.
- Earnings Revisions: On December 31, the estimated earnings growth rate for Q4 2018 was 12.2%. Six sectors have higher growth rates today (compared to December 31) due to upward revisions to EPS estimates and positive EPS surprises.
- Earnings Guidance: For Q1 2019, 33 S&P 500 companies have issued negative EPS guidance and 9 S&P 500 companies have issued positive EPS guidance.
- The blended, year-over-year revenue growth rate for the fourth quarter is 6% today, which is above the revenue growth rate of 6.2% last week.
- Valuation: The forward 12-month P/E ratio for the S&P 500 is 15.7. This P/E ratio is below the 5-year average (16.4) but above the 10-year average (14.6).
- During the upcoming week, 103 S&P 500 companies (including 1 Dow 30 component) are scheduled to report results for the fourth quarter.
As I look through FactSet’s forecast and data what we come to understand most prominently occurring and being reported is the lowering of analysts’ estimates. During the month of January, analysts lowered earnings estimates for companies in the S&P 500 for the first quarter. The Q1 bottom-up EPS estimate (which is an aggregation of the median EPS estimates for all the companies in the index) dropped by 4.1 percent.
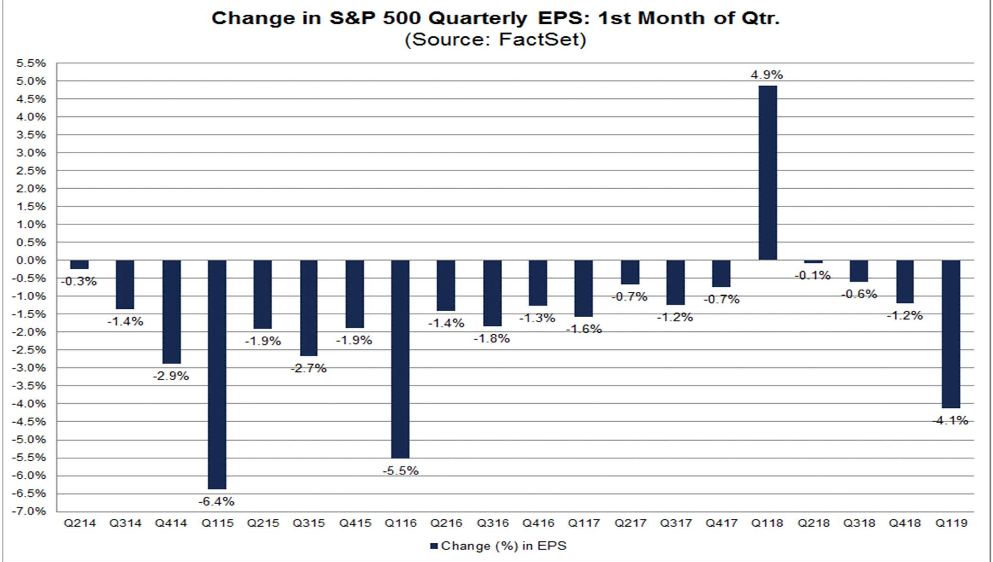
The decline in the bottom-up EPS estimate recorded during the first month of the first quarter was larger than the 5-year, 10-year, and 15-year averages. In fact, the first quarter marked the largest decline in the bottom-up EPS estimate during the first month of a quarter since Q1 2016 (-5.5%). As I have mentioned in previous Weekly Research Reports, the current market fears and market correction greatly mirror the fears that surfaced in late 2015 and persisted through early 2016, but then subsided with a strong economic and global equity market performance. Will that be the case this time around?
Ultimately and due to the outsized decline in Q1 EPS estimates, FactSet is now forecasting an earnings decline for the Q1 2019 period. Moreover, for the totality of 2019 the table presented below indicates that FactSet is forecasting S&P 500 EPS to grow just below 6% for the period.
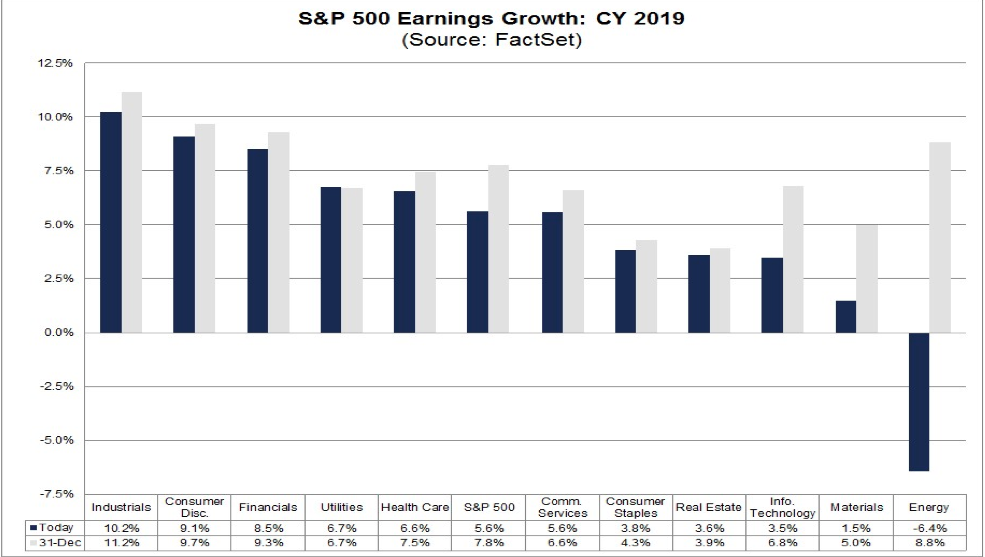
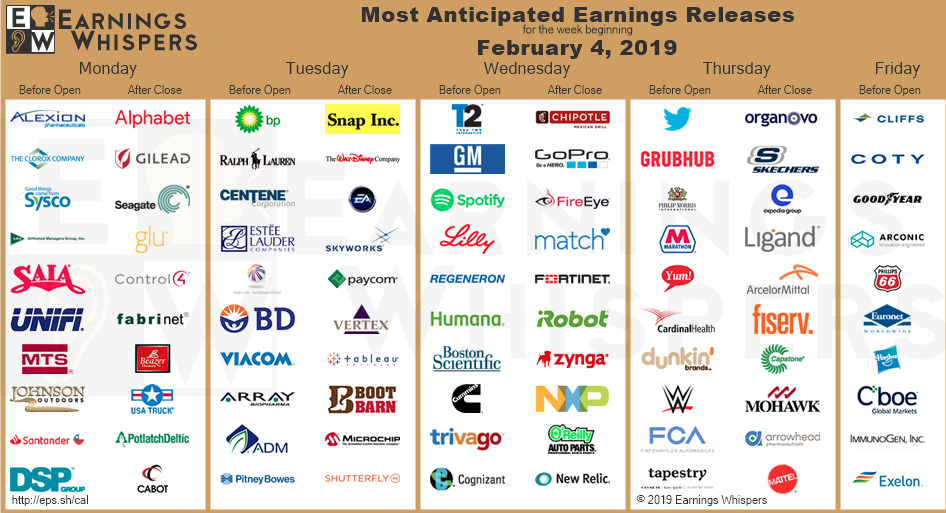
Rounding out this earnings segment is a graphic of key earnings reports for the coming week. You’ll notice the last of the FAANG stocks will report after the closing bell on Monday, via Alphabet (GOOGL ). Beyond that, there’s a good deal of consumer-centric companies reporting.
Uh Oh, Fund Flows
At the onset of 2019, fund flows were positive for equity ETF’s but have since painted a different picture, even as the market has trended higher to end January 2019. This is not something I like to see in a rising market environment, especially after a sharp decline. Why? Well, this basically indicates a degree of short covering rather than actual long-term buying has resulted in some of the market gains. Below is a table of some of the most prominent equity ETFs and their net negative flows to-date.
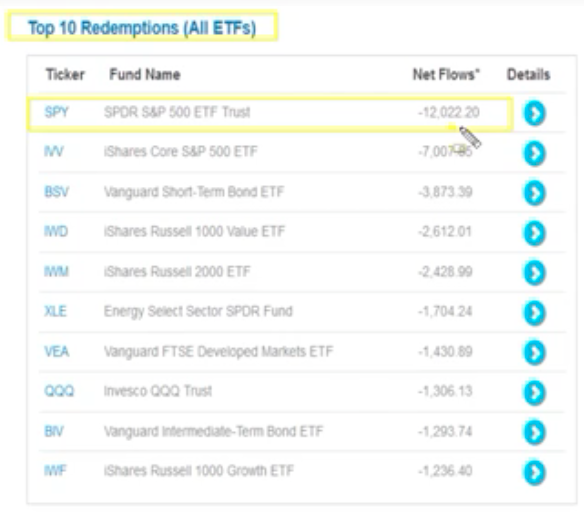
Consequently, when we look at where there were inflows, we don’t want to see safe-haven assets like GLD (Gold fund) and/or TLT (bond fund) with such inflows. Investors of consequence simply don’t believe the current equity market rally is either sustainable or presenting an opportunity.
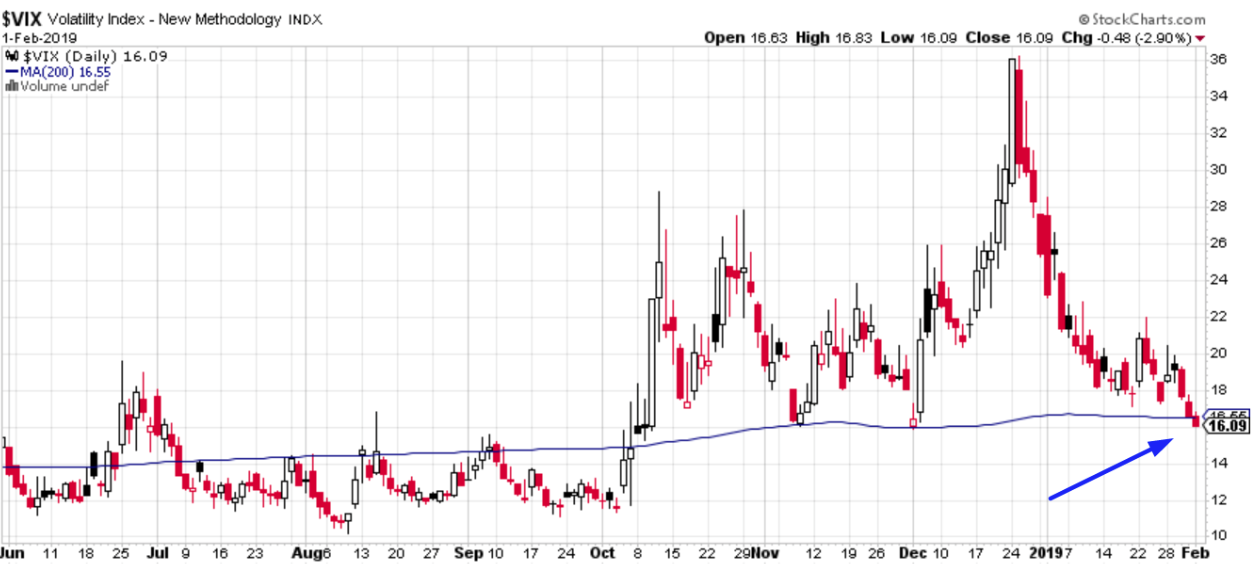
Market volatility has been absolutely crushed during the market rally. As depicted in the chart above, the VIX fell below its 200-DMA for the first time since last October. Statistically speaking, what happens next to the S&P 500 when VIX closes below its 200-DMA for the first time in 3 months? (See Table Below by Troy Bombardia)
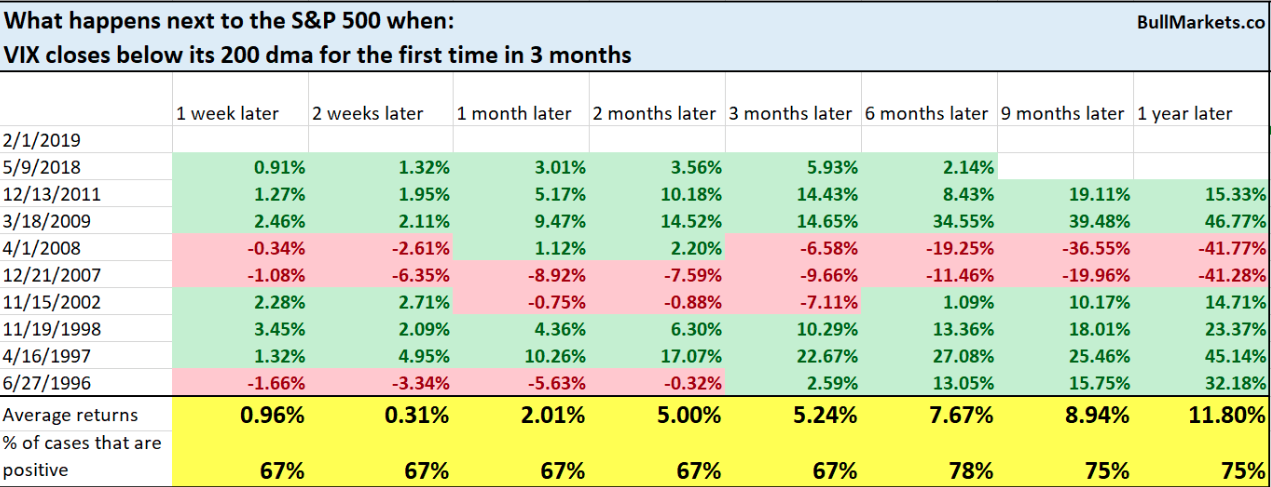
As one can see from the data above, the stock market has a better chance of rising both near-term and longer-term given the criterion. This is somewhat contrary to our prior study noted above regarding the SPX 5 out of 6-week winning streak.
What is clear from the VIX chart above is that each time the VIX has tested current levels between 15.94 and 17.17, it has bounce higher and quite significantly. I don’t suggest this is a technical issue as the VIX is a stochastic process measurement, but rather it was a result of market fundamentals and a fear of those fundamentals proving a disappointment i.e. earnings. As such, the chart above may not find a near-term bounce without a more significant pullback in the S&P 500. We’ll see what happens next.
Economic Data
Last week’s economic data was rather strong, from labor and employment data on up to the latest ISM reading. The Institute for Supply Management said its manufacturing index rebounded in January to 56.6% from 54.3% in the prior month. The index was 58.8 in November. The latest reading, derived from a survey of executives, exceeded the MarketWatch forecast of 54.3 percent.
The Nonfarm Payroll report released Friday continues to express a strong and even improving labor market, this late in the economic cycle. The U.S. gained 304,000 new jobs in January, the biggest increase in almost a year. Instead, the government slashed its original estimate of new jobs in December to 222,000 from 312,000 as part of an annual update based on newly available information. That’s the largest monthly revision since 2010.
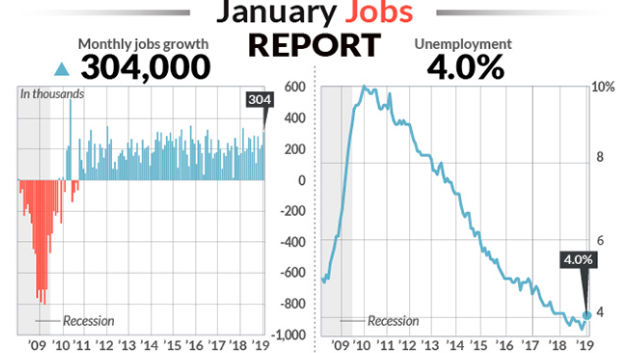
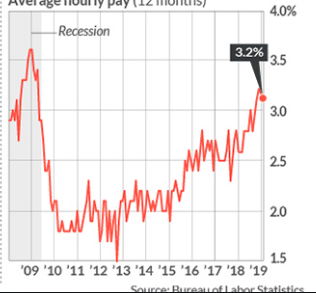
Still, the economy has added an average of 241,000 jobs a month since November, marking one of the best stretches during a nearly 10-year-old economic expansion. And employment gains in 2018 were the strongest in three years. The average wage paid to American workers rose 3 cents to $27.56 an hour. The increase in hourly wage over the past 12 months dipped to 3.2% after holding at a post-recession high of 3.3% in the prior three months.
While all those labor and employment numbers are great, the best numbers come from the labor participation rate. The labor force participation rate moved to a multi-year high of 63.2%. Meanwhile, the portion of the population that’s officially in the labor pool moved to a multi-year high of 60.7 percent. In no uncertain terms and despite the government shutdown, more of the country is working than has in past years. What more can you possibly want in a consumer-driven economy? More people working = more people spending = more revenues and more earnings. Below is a table of this week’s economic data releases:

Investor Takeaways
With China’s market closed this coming week, we can’t be certain of the liquidity drain from the holiday week in China. The reasons to buy the SPX are currently growing, but the need to do so with the Index in overbought territory and prior to a pullback are limited. Central bank dovishness, trade feud resolution near-term and even a 15% move off the bottom for the S&P have seemingly been offset with regards to investor sentiment, which remains low historically.

This may be due to the reality that analysts’ earnings expectations have dropped significantly for the Q1 2019 period. Additionally, fund flows are pretty transparent and suggest the current market rally may not have much room for upside near-term.
Given all that I’ve outlined in this narrative, I believe that risk-on is still the market environment even if a pullback of 3-7% is found. I believe such a pullback will be bought based on the FY19 EPS forecasts to-date, unless otherwise disrupted by macro-fundamentals.
Check out Finom Group's (for whom I am employed) weekly technical market recap and go-forward analysis with this link.


The inefficiency of tariffs are huge. Steel tariffs and the subsequent hope that China reduce its capacity for steel production seems to be a huge policy error. All we need for a slower world economy is higher priced steel. Add to this that Huaweii makes superior cellphones for a whole lot less money and American financial efficiency is doomed. Americans are being bled by Apple, by big pharma and by steel tariffs. Can you imagine where we would be as a nation if we had protected our pre Japan crappy auto companies? We will become a fossil of a nation for sure if tariff man isn't curtailed.