
That warm sense of everything going well is usually the body temperature at the center of the herd. ~ John Masters
In this week’s Dirty Dozen [CHART PACK] we look at monthly charts for the SPX, bonds, gold, DXY, and more…
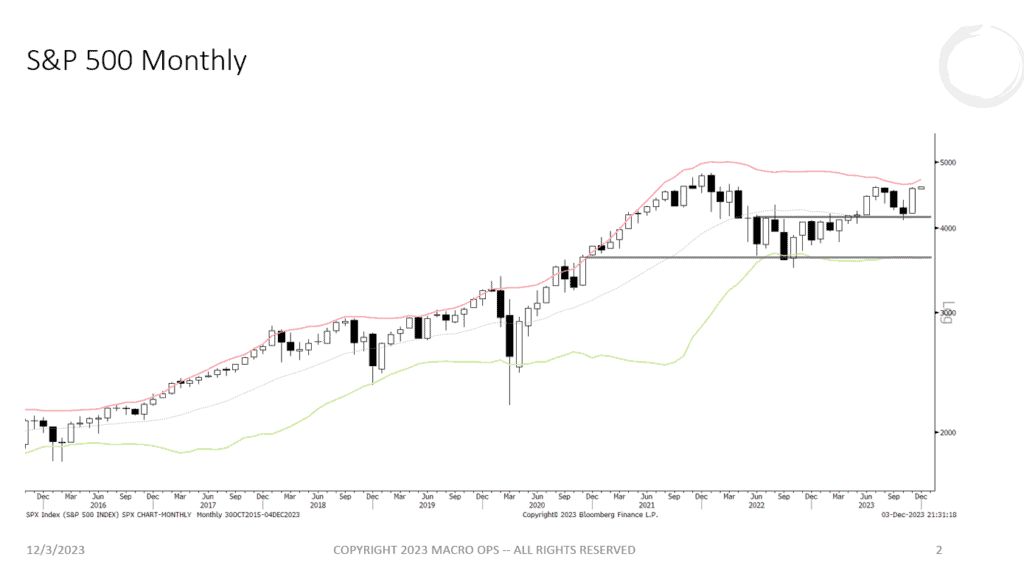
1. The market saw a strong close for November. It’s now within 5% of its ATH and the current odds favor an eventual breakthrough to new highs in the months ahead.
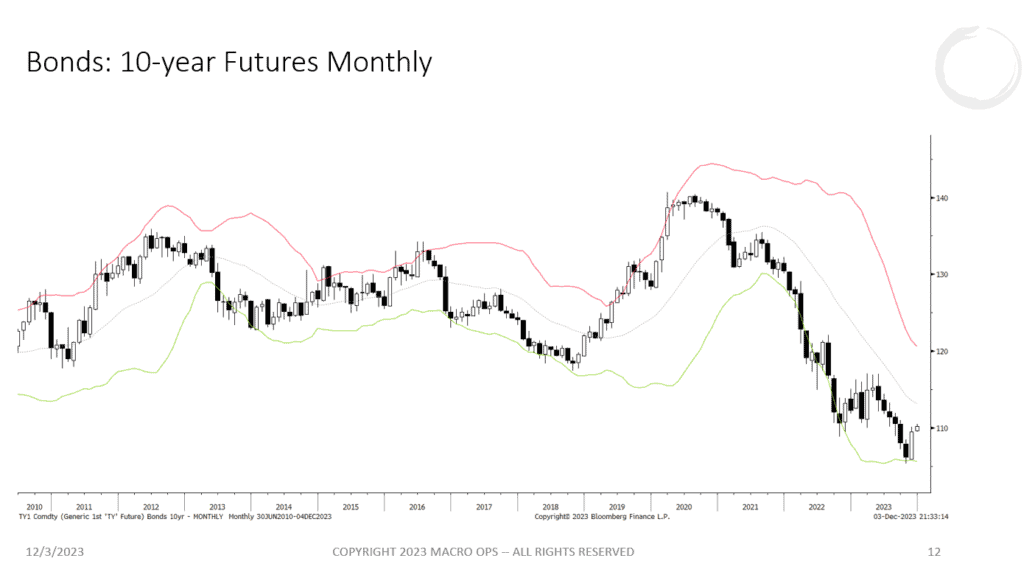
2. We pointed out the high probability of a reversal in bonds back in October as they had climaxed in a parabolic selloff down to their lower monthly Bollinger Band. At the same time, our yield leads had been signaling a reversal.
The current odds favor more upside follow-through in the short term. But we often see double bottoms following moves like the one we’ve seen this year, so be on the lookout for renewed weakness in the tape.
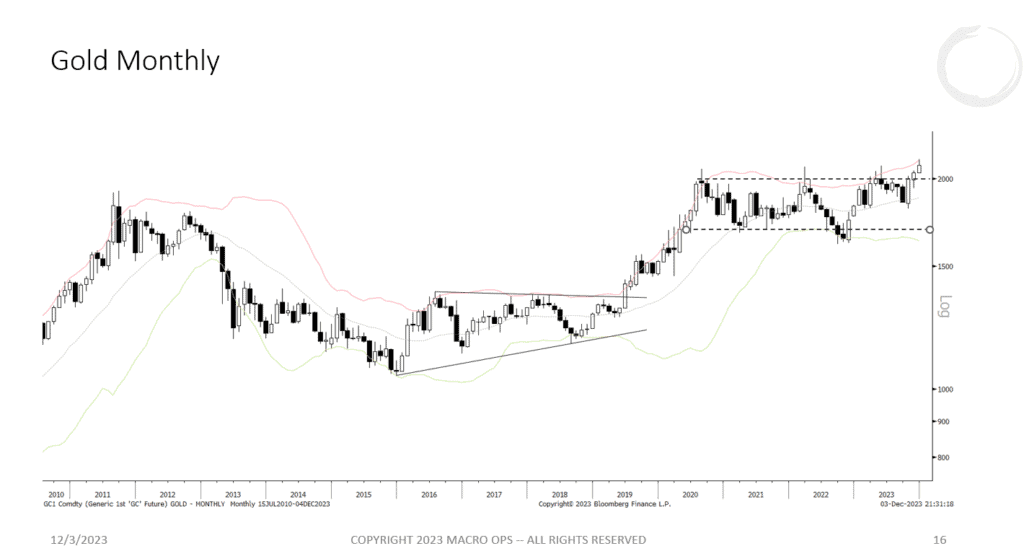
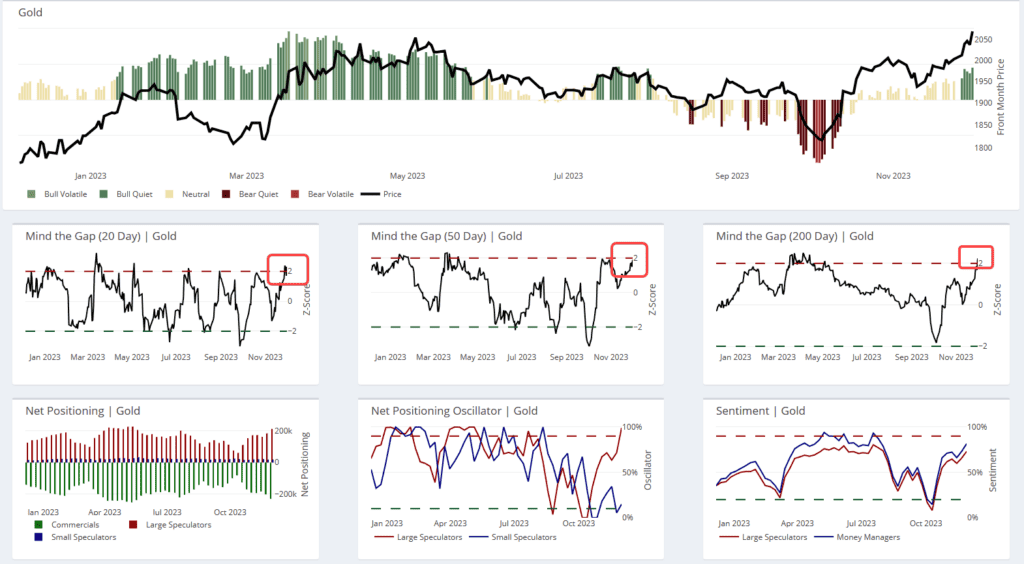
3. Gold has finally got a monthly close above its key 2k level. This is a strong breakout signal following a multi-year sideways range. In plain speak, this means gold is going much higher in 24’.
We’ve been long for a few weeks but will be building our position on pullbacks (same with silver though the silver market tends to be somewhat tougher to trade).
4. The macro fundamental outlook for gold is about as good as it gets. You can read more on how we analyze PM fundies here.
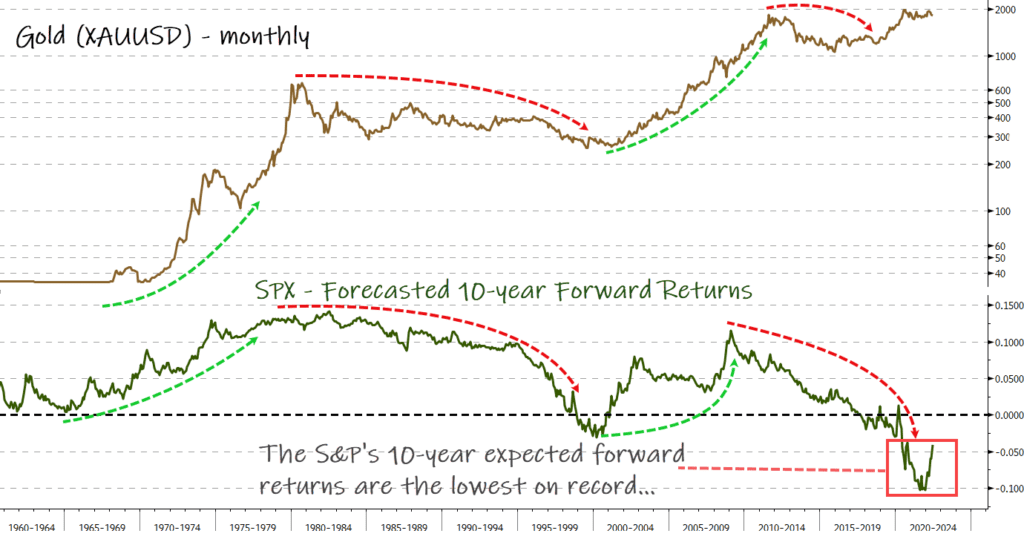
5. And while gold’s long-term prospects are great, it’s very extended over the short term and therefore increasingly susceptible to a retrace soon.
Our multichart view below shows that gold is 2std overbought from its 20, 50, and 200-day moving averages. At the same time, we’ve seen a big jump in large spec positioning over the past couple of weeks. So likely we get a bit of a shakeout soon.
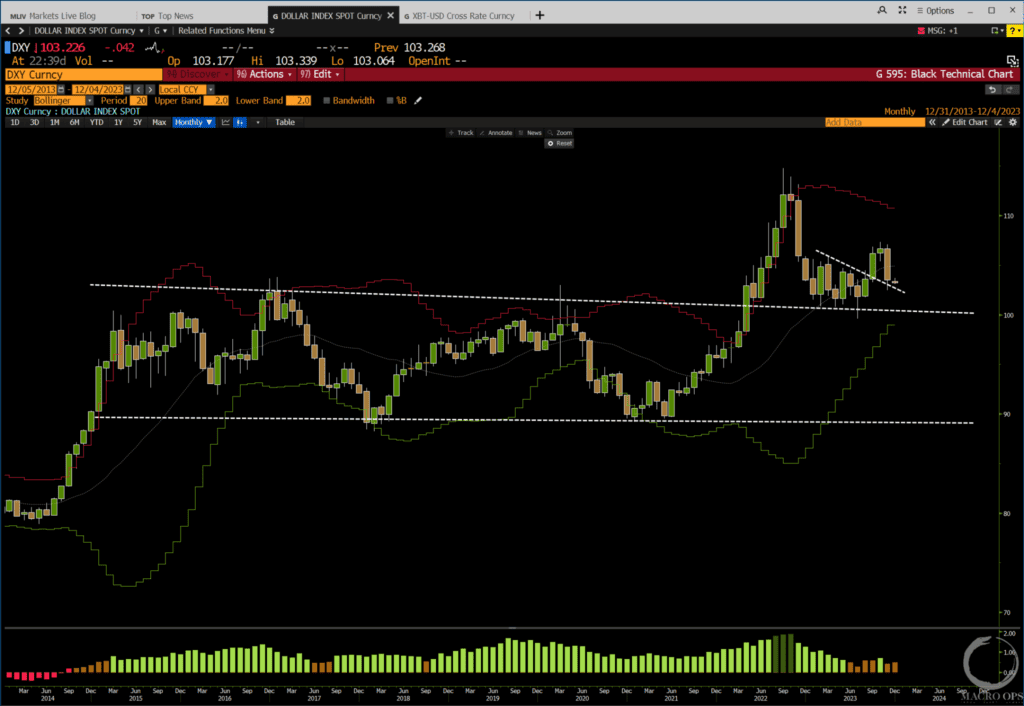
6. The DXY closed near its lows for the month and now finds itself at a key level. A close below its most recent breakout level would invalidate the move and raise the odds of downside continuation.
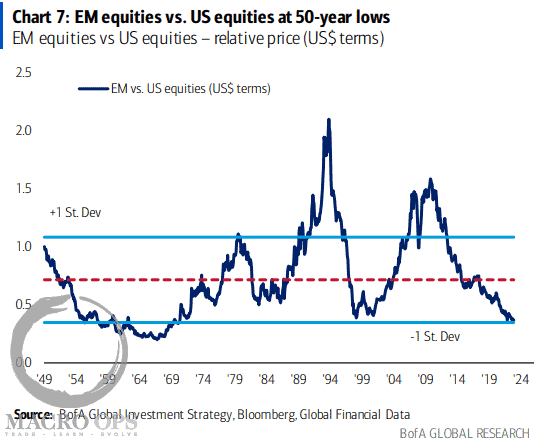
7. According to BofA EM equities relative to the US have fallen to 50-year lows. When this trend begins to reverse it’ll have big (negative) implications for USD.
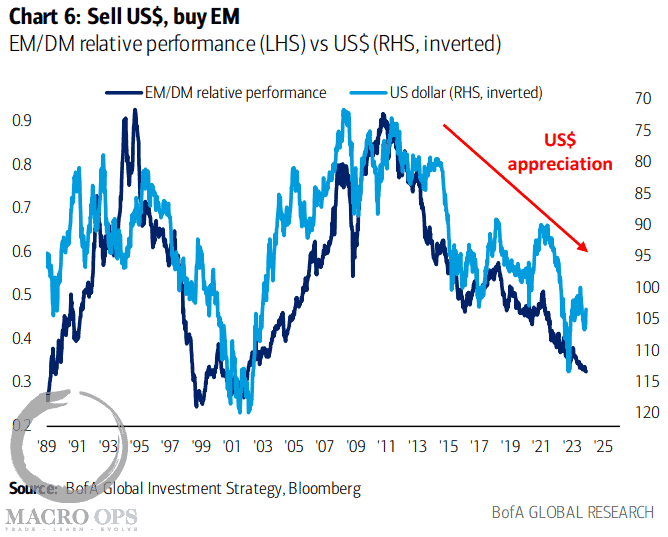
8. And that’s because there’s a high correlation between the two (chart via BofA). To read more about why that is, you can read my piece on Soros’ Currency Framework here.
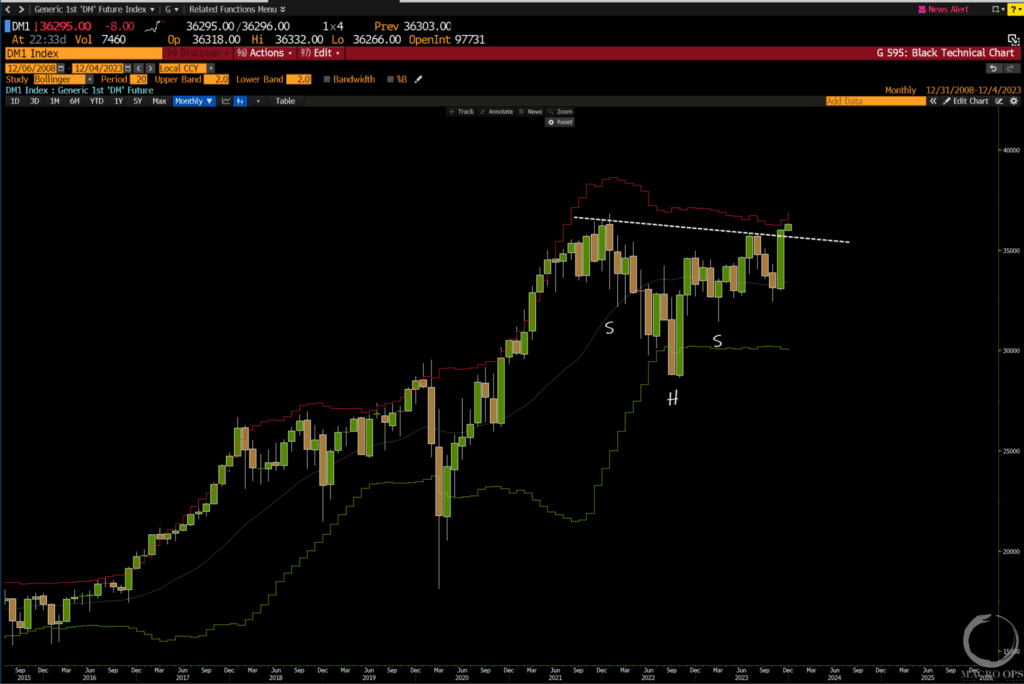
9. We’ve been pointing out the bullish setup in the Dow for the past month. Very crowded short positioning combined with increasingly strong technicals, made for a nice setup.
Well, November didn’t disappoint as we saw the Dow complete an inverted H&S continuation chart. The measured move target for this breakout is 40,000’ish.
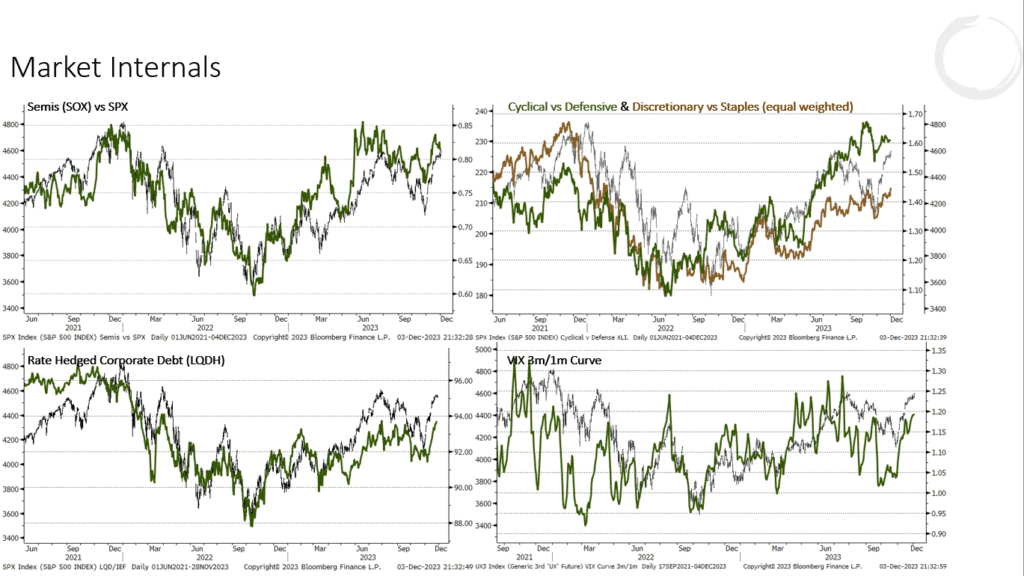
10. While the market is stretched a bit in the short-term we still like the bull side as liquidity continues to ease and market internals continue to support the broader trend up.
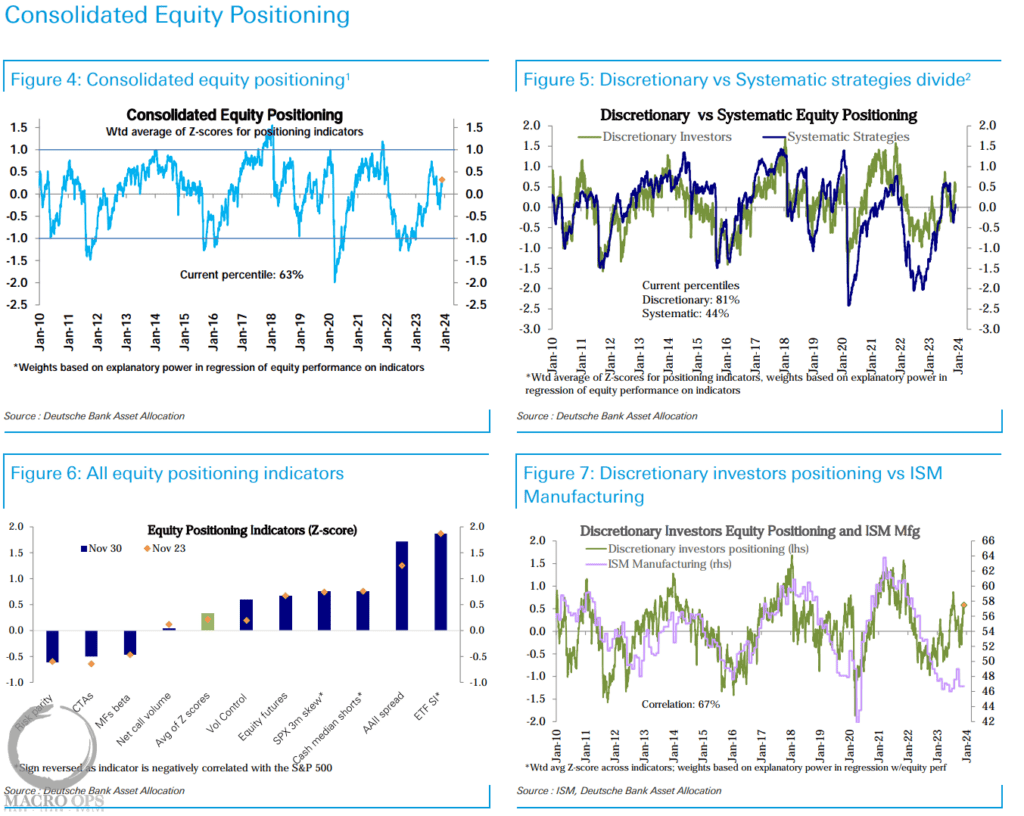
11. Sentiment/positioning is getting more bullish but remains below levels that signal one should turn cautious.
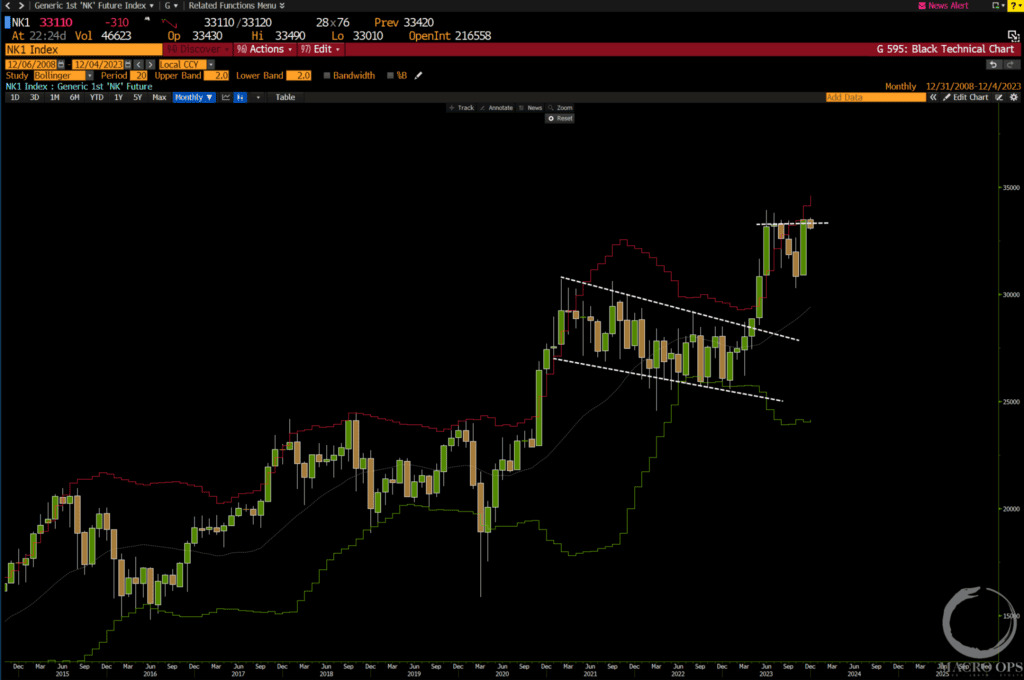
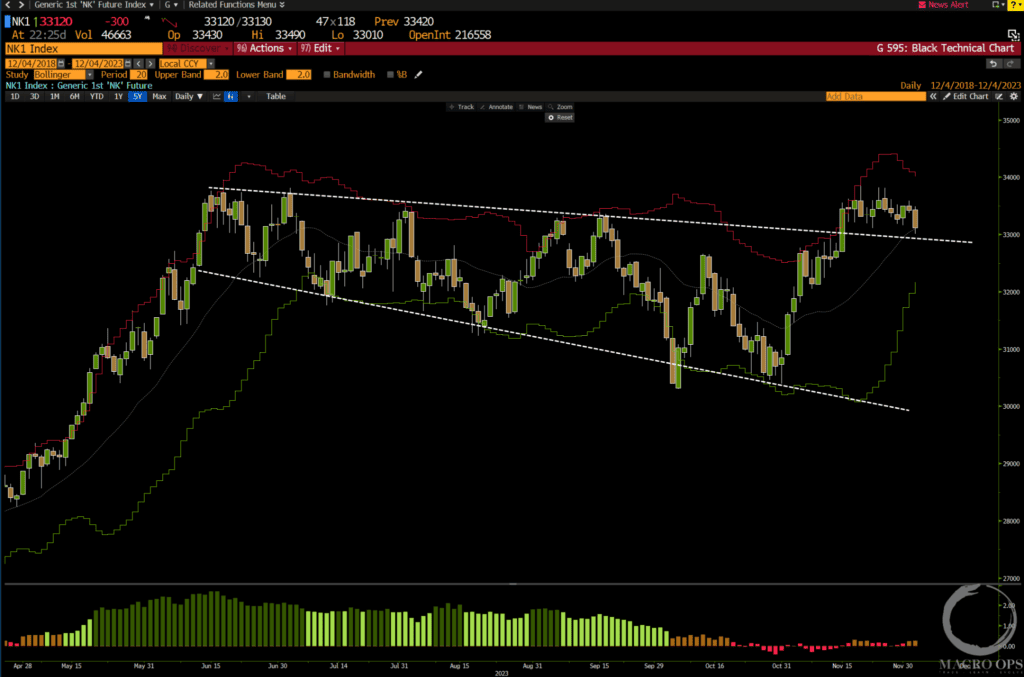
12. We still like Japan’s Nikkei here (first chart is a monthly, second is a daily). November saw a strong bullish thrust out of its 3-month pullback consolidation.
One could put a buy stop above the recent daily consolidation area to let the market pull you in on confirmation of technical follow-through.
More By This Author:
Can The Gold Bulls Pull Through?
More Fuel For The Bulls
Hedge Fund Exposure At Record Lows…


Comments
Log in or sign up to join the conversation.