
Market Analysis - Thursday, June 5

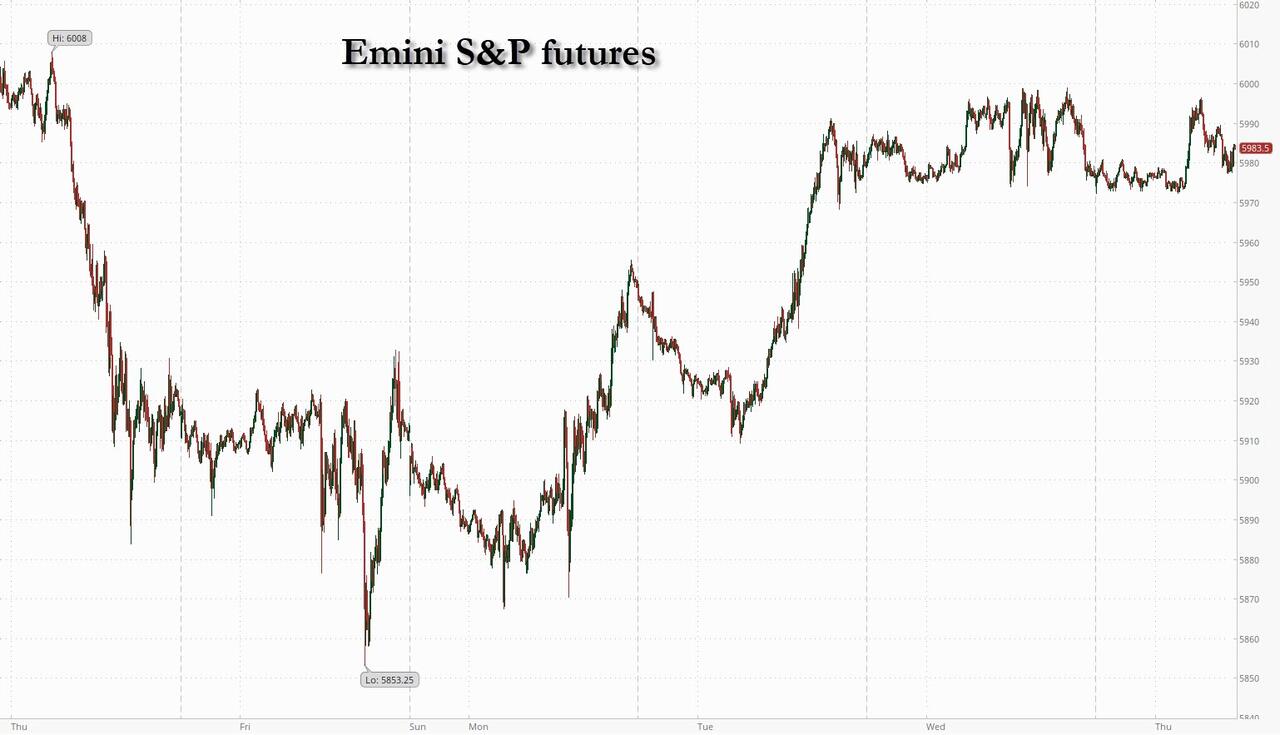
SPX futures remained in a very narrow band beneath yesterday’s high. Today is day 252 in the Master Cycle, leaving a probable week to completion. Wave [2] offers a complex triple zig-zag formation that is nearing its reversal point. Fractal relationships suggest a high between 6020.00 and 6050.00. Fractals reveal self-similar structures that offer a key to the behavior of crowds. The first rising fractal starting on April 7 (646 points) ending on April 9 represents institutionalized profit taking. The second rising fractal from April 21 to May 19 (864 points) represents short covering by the general populace. The third rising fractal from May 23 to the present (223 points thus far) may represent exhaustion of the trend, as there are few shorts left and retail investors reluctantly get on board. However, time is running out, with only a possible week left to the end of the retracement Cycle, should it last that long.
Today’s options chain shows Max Pain at 59975.00. Long gamma resides above 6000.00, while short gamma strengthens beneath 5950.00.
ZeroHedge reports, “US equity futures are unchanged, as they struggle for direction ahead of Friday’s payrolls report, following a series of data releases that offered mixed signals on the health of the economy. As of 8:00am, S&P futures are flat, having traded on either side of the unchanged line during the overnight session and followed a slurry of weak macro data releases which saw Wednesday’s gains erase and recover, with the S&P ultimately ending the day flat. Nasdaq 100 futs are down 0.1% with Mag 7 stocks mostly higher except for TSLA (-1.6%). Stocks and bonds in Europe gained ahead of the ECB’s expected 8th consecutive interest rate cut. The yield on 10-year US Treasuries steadied as Wednesday’s bond rally faded. The dollar reversed earlier losses even as gold surged to briefly top $3400. Commodities are mostly mixed with notable outperformance in silver (+3.1%). News flow since yesterday’s close has been largely muted: headlines continue to focus on trade negotiation development, particularly implication on rare earth curbs (BBG and CNBC) and upcoming Trump-Xi call.”
(Click on image to enlarge)

VIX futures probe lower to 17.22 this morning. Today 17.15 may be the “line in the sand” for this particular decline. It may alert us to an imminent reversal.

TNX futures tested the mid-Cycle support at 43.04 and bounced this morning, possibly marking the Master Cycle low. It is hovering near the 50-day Moving Average at 43.49. Should it exceed that level, a buy signal may be made. One wonders why the TNX cannot decline further in the face of higher jobless claims. The problem is that growing fiscal largesse may make it impossible to control interest rates in the face of growing reluctance by bond buyers.

Bitcoin continues to ride Intermediate support at 104439.00. A breakdown beneath that level suggests that the 50-day Moving Average at 100325.00 may offer the next support. The Cycles Model suggests today may offer the beginning of trending strength. A decline beneath current suport may trigger a series of strong moves to the downside.
More By This Author:
Market Analysis - Friday, May 30Market Analysis - Tuesday, May 27
Market Analysis - Friday, May 23
Nothing in this email or article should be construed as a personal recommendation to buy, hold or sell short any security. The Practical Investor, LLC (TPI) may provide a status report of ...
more

