
Major Asset Classes - May 2021 Risk Review
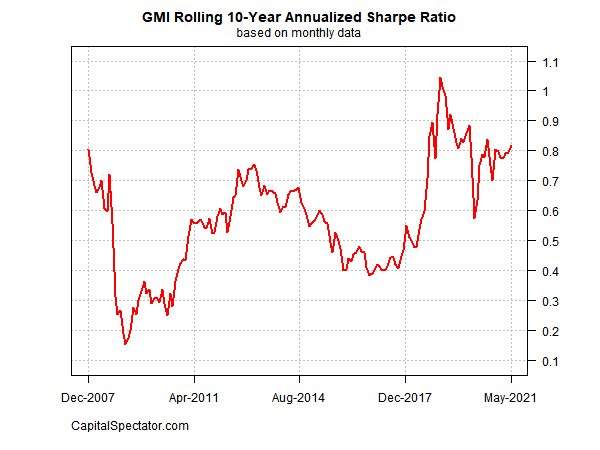
Risk-adjusted performance for the Global Market Index (GMI) continued to tick higher in May.
GMI’s Sharpe ratio — a measure of risk-adjusted return – rose to 0.82 on a trailing 10-year basis through last month. That’s close to a pandemic high, but still well below the Sharpe ratios for GMI that prevailed before the coronavirus crisis. A Sharpe ratio of 1.0 equates with return matching risk (return volatility). Higher (lower) Sharpe ratios indicate higher (lower) risk-adjusted performance.
GMI is an unmanaged, market-value-weighted portfolio that holds all the major asset classes (except cash) and represents a theoretical benchmark of the “optimal” portfolio. Using standard finance theory as a guide, this portfolio is considered an optimal strategy for the average investor with an infinite time horizon. Accordingly, GMI is useful as a baseline to begin research on asset allocation and portfolio design. GMI’s history suggests that this benchmark’s performance is competitive with active asset-allocation strategies overall, especially after adjusting for risk and trading costs.
For additional context, the table below presents several return and risk metrics for GMI and the underlying asset classes on a trailing 10-year basis.
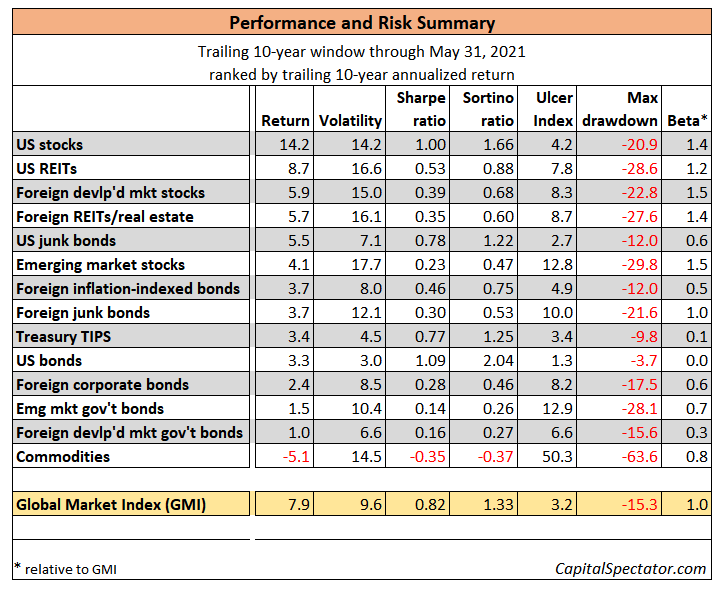
Here are brief definitions of each risk metric:
Volatility: annualized standard deviation of monthly return
Sharpe ratio: ratio of monthly returns/monthly volatility (risk-free rate is assumed to be zero)
Sortino ratio: excess performance of downside semivariance (assuming 0% threshold target)
Ulcer Index: duration of drawdowns by selecting negative return for each period below the previous peak or high water mark
Maximum Drawdown: the deepest peak-to-trough decline
Beta: measure of volatility relative to an index (in this case GMI)
Disclosures: None.


