

Image source: Wikipedia
The US Federal Reserve could soon deliver the last hike of the current cycle. While 10Y yields have seen their peak already, it will need the imminent prospect of rate cuts to re-steepen the curves. We think cuts will come before the year ends, but the Fed is still pushing a higher-for-longer narrative keeping re-steepening reflexes at bay.
Markets are expecting the Federal Reserve to hike one more time at the upcoming May meeting. It is widely assumed that this will also be the last time the Fed will increase rates, thus concluding the current tightening cycle. This warrants a closer look at how market rates have behaved around previous similar turning points. Below we illustrate market patterns around the end of the past four tightening cycles starting in 1994 through to 2015.
The Fed could start cutting earlier and more substantially than markets currently price
Every tightening cycle had its unique set of circumstances and a lot hinges on the ‘landing’ of the economy that the Fed achieves. A softer landing means that policy rates can remain at the peak level for a more prolonged time, such as happened in 1994-95 or 2004-06. Looking at the current cycle, markets fully discount a first 25bp cut six months from the peak, implying a relatively short period of stable rates. Our economists think the Fed could start cutting even earlier and more substantially than markets currently have priced.
Fed tightening cycles since 1994, including the current one
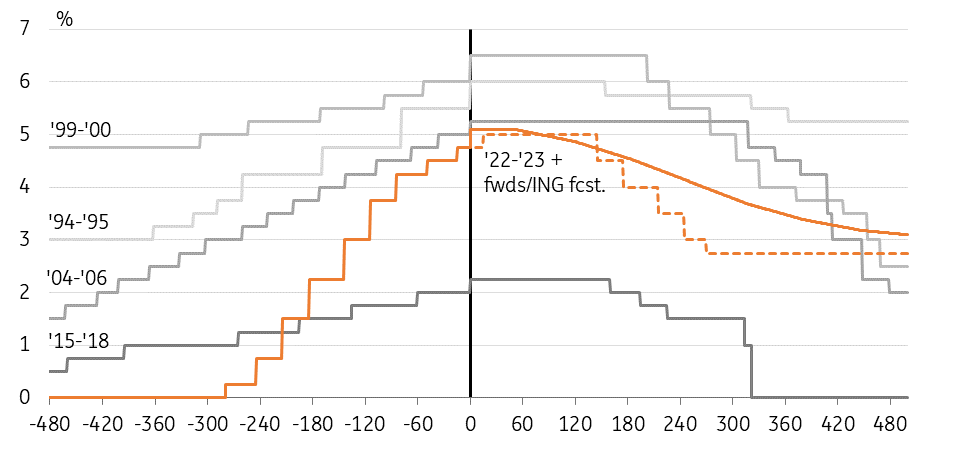
Image Source: FRED, Refinitiv, ING
10Y yields are already looking downward from here
Outright 10Y Treasury yields usually peak before or at the latest with the final Fed hike. They trended lower to turn around only after the first couple of cuts have been completed. For the current cycle, we are relatively confident that the peak since the banking turmoil has added the prospect of a credit crunch to the equation. Inflation trending lower, plus a flight from riskier assets, are the common factors weighing on longer-term rates post the Fed peak.
Our own forecast sees 10Y UST yields falling toward 3% by the end of this year with the Fed itself seen lowering key rates to the same level by mid-2024. A pick up in 10Y rates thereafter should then largely come with brightening economic prospects.
10Y UST yields usually peak before or at Fed tightening cycle highs
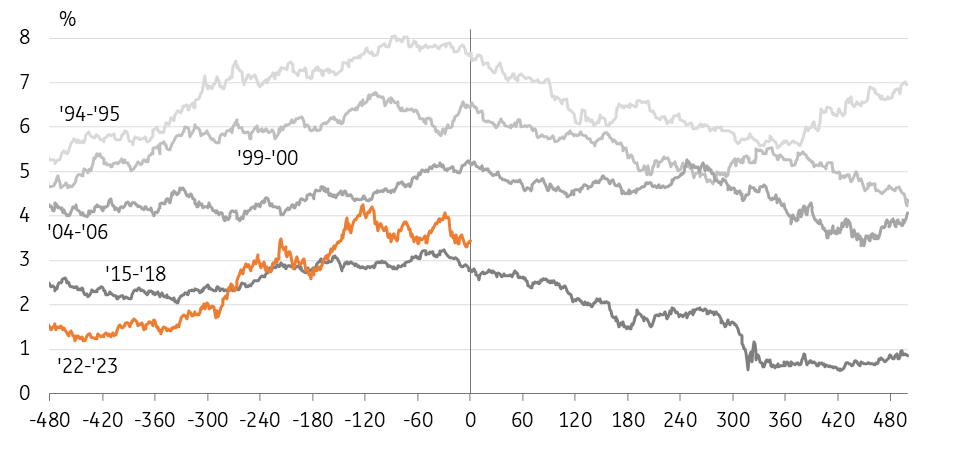
Image Source: Refinitiv, ING
The re-steepening of the 2s10s curve usually only picks up once rate cuts are imminent
For the yield curve, illustrated with the 2s10s UST curve, reaching the peak in the policy rate has usually marked the end of the more pronounced curve flattening dynamic. In the initial months, the curve proved quite stable. While the front part of the curve 2s5s in many instances still trended flatter, this was compensated by the 5s10s segment starting to steepen.
In other words, the 5-year part of the curve outperformed in anticipation that cuts would eventually follow a period of stable rates. Only once the prospect of rate cuts became more imminent, leading the 2-year rate to also follow lower, did the 2s10s curve start to display a steepening dynamic. The common observation is that flattening, if it occurs, is limited and largely temporary.
2s10s UST: past the policy peak, re-steepening dynamics only pick up closer to actual rate cuts
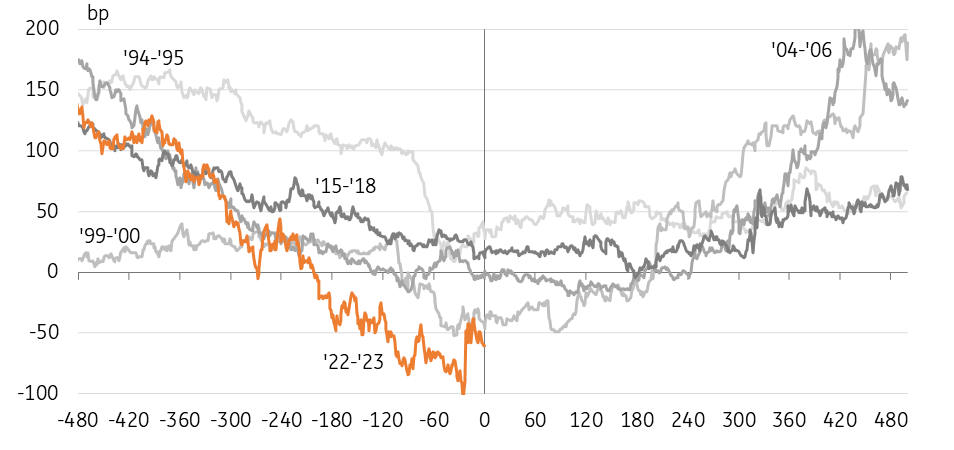
Image Source: Refinitiv, ING
The Fed pushing a higher-for-longer strategy prevents near-term re-steepening dynamic
A key takeaway for the UST curve is that it is more the prospect of interest rate cuts that re-steepen the curve rather than the end of hikes – we currently have the first-rate cuts penciled in for the fourth quarter of this year. The higher-for-longer scenario that the Fed is currently pushing on the back of signs that the banking turmoil might blow over raises the risks that the central bank might not cut anytime soon. This would at the least prolong the period until we see the re-steepening dynamic taking hold. But as mentioned before, material curve flattening at this stage of the cycle is rare and usually not persistent.
Looking at current valuations going into the Fed’s next policy phase, the 2s10s curve remains historically flat/inverted to begin with, even after the snap re-steepening in the wake of the latest banking turmoil. That arguably leaves more room for the curve to re-steepen going forward and suggests that setting steepeners as the Fed peaks are a low-risk strategy. The real issue that market participants face is the high running cost of funding the curve-steepening strategy, especially if gains from the actual re-steepening take time to realize. That is also one reason why we see longer periods of relative curve stability.
More By This Author:
FX Daily: Time For Some Stabilization?Sticky UK Inflation Data Helps Unlock May Rate Hike
Rates Spark: The Yield Race To The Top Continues


Comments
Log in or sign up to join the conversation.