

Image Source: Pixabay
The banking crisis has almost made us forget that the Fed's rate hike also deeply affects the level of public deficits. This subject should be the focus of attention...
As I wrote in my bulletin at the beginning of the year:
"With rising interest rates, states that have increased their debt are forced to incur more expenses to pay down more and more debt at a time when tax revenues are declining. And on top of that, these states are now being asked to relieve economic activity in the face of slowing private demand.
The equation is becoming impossible and this is reflected in the monthly budget deficit figures. (...)
In this impasse, there are unfortunately not many choices left.
Turning back would trigger the recession that the country has avoided so far, precisely in anticipation of this policy action.
Continuing in this impasse leads us to the great wall of debt."
There it is, we have arrived!
While the banking crisis dominated the news, the United States reached the authorized ceiling in the last debt-raising vote (the 78th since 1960!).
In other words, if the ceiling is not raised, the country will default on its debt for the first time in its history.
This threat to the U.S. Treasury comes at a time when central banks are gradually turning away from the dollar by liquidating their U.S. Treasury bonds, signing commercial partnerships in currencies other than the dollar, but also by increasing their purchases of gold.
Since 2021, the movement of disaffection toward US Treasury bonds has been growing.
Initiated by central banks, sales of Treasury bonds have accelerated in recent weeks with the banking crisis.
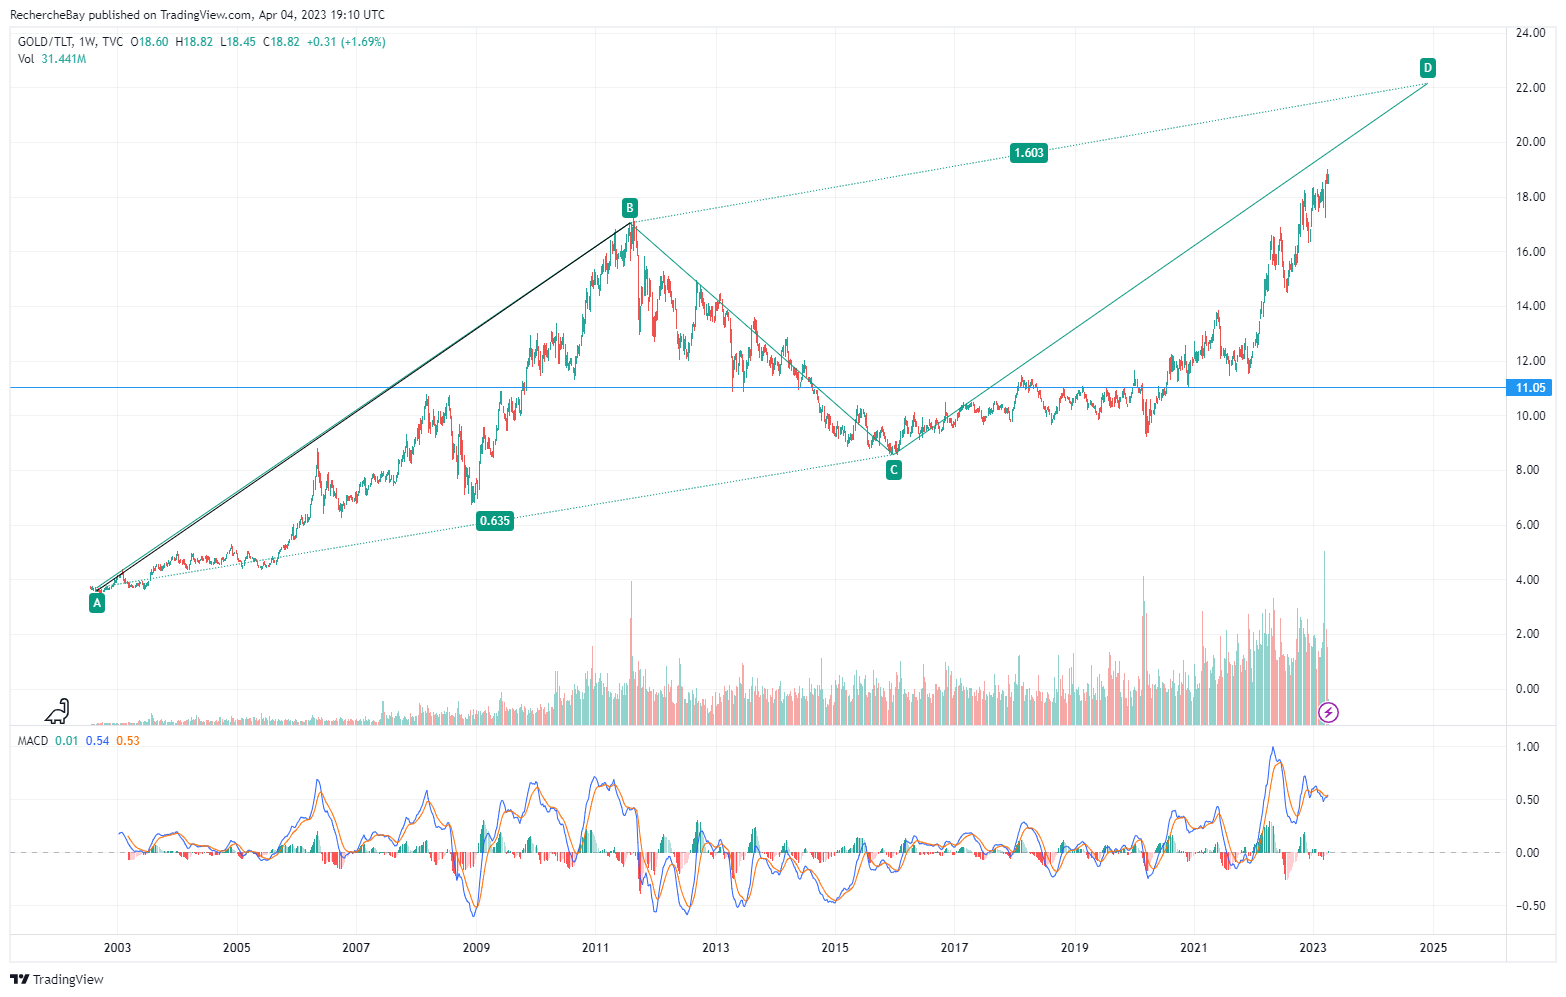
Gold is benefiting from this disaffection for this traditional safe haven asset, which is no longer a safe haven. The Gold/TLT ratio, which measures the interest level of gold compared to US bonds, is at an all-time high, on its way to completing the ABCD figure drawn two years ago:
(Click on image to enlarge)
In my March 2021 bulletin, I already noted a breakout in the GOLD/TLT ratio:
(Click on image to enlarge)
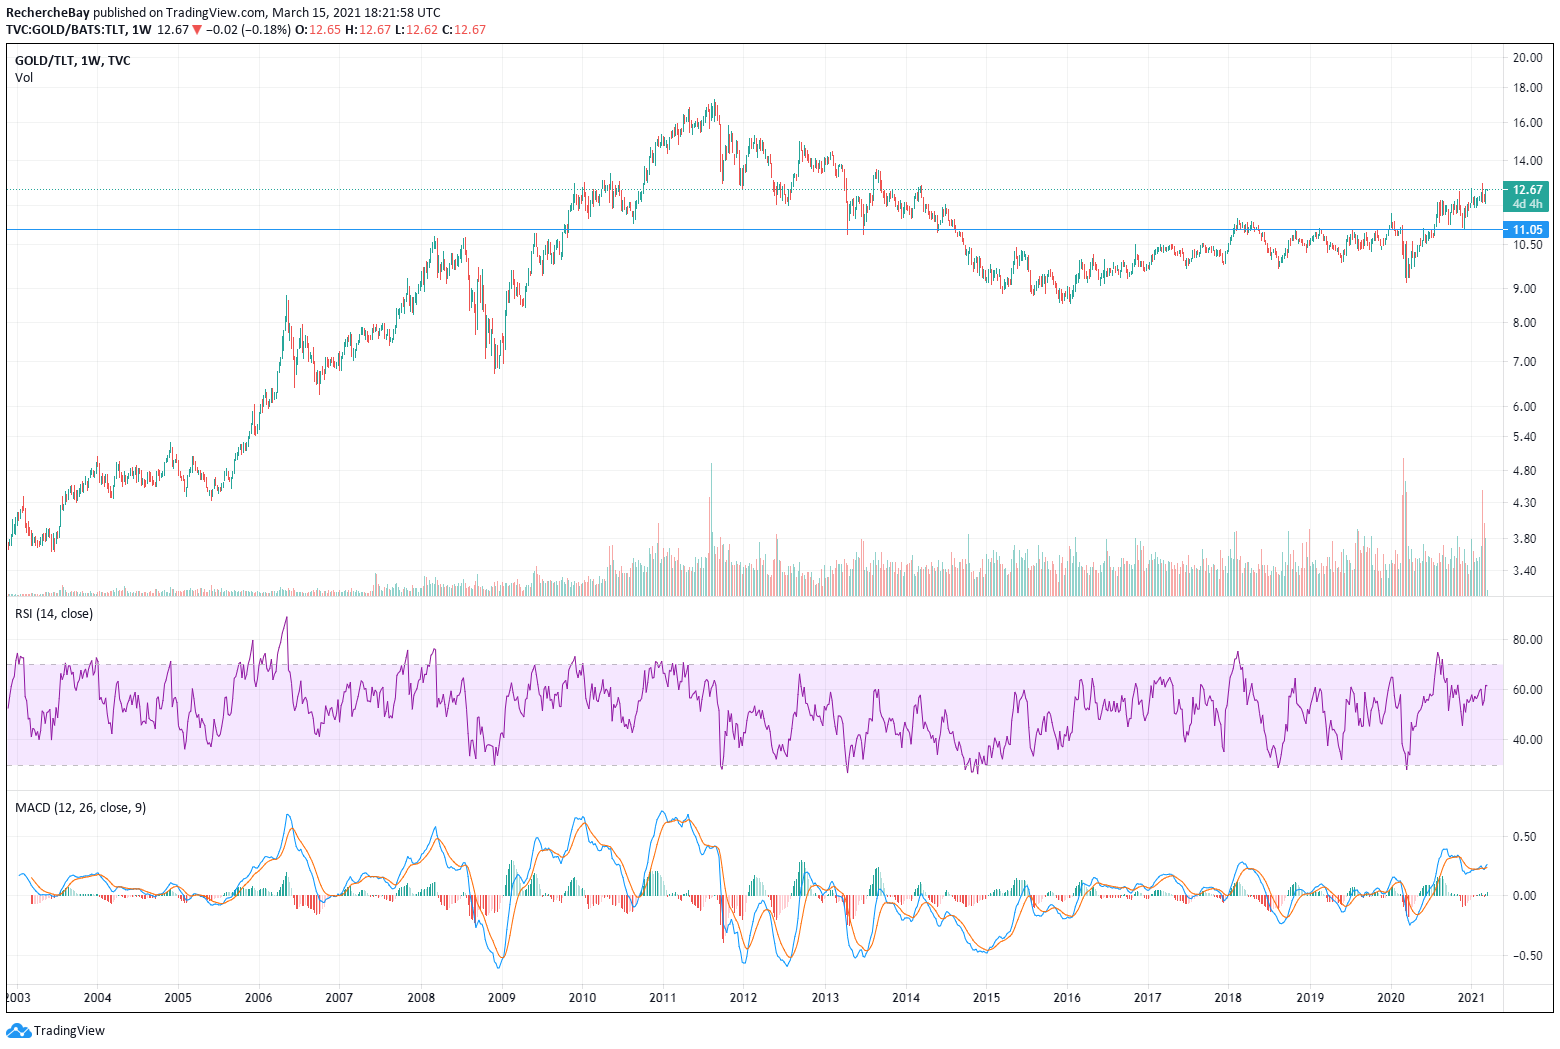
I added: "This type of configuration is the most anticipated by long-term investors in gold. As during the 1970s, we find ourselves in a “gold purchase - sale of treasuries” configuration”, which is susceptible to drive the price of gold to levels that are much higher than in 2020."
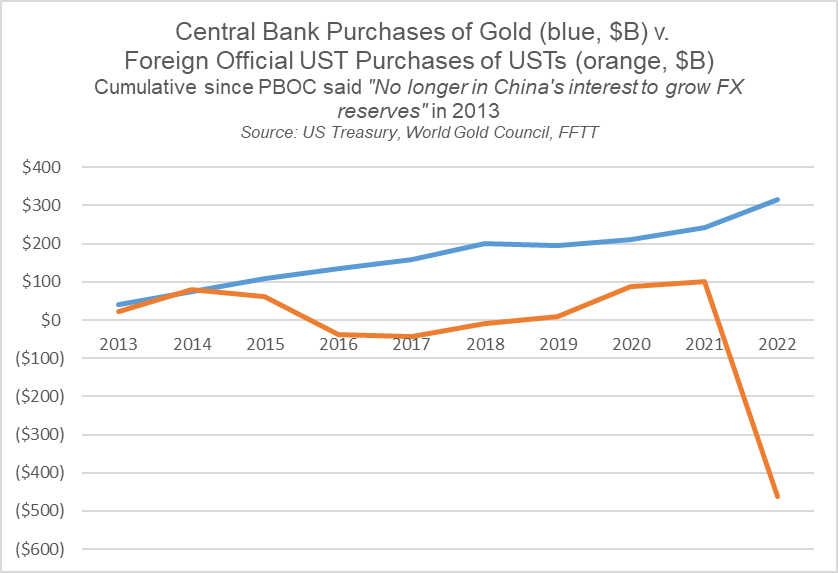
This breakout level has been well confirmed. From 2021 onwards, we have seen a massive sale of US bonds by central banks, especially those of the BRICS and particularly China:
As I wrote in my monthly bulletin reserved for GoldBroker.com clients:
"U.S. Treasuries are no longer the "safe haven" they were during the last episodes of banking stress.
Gold is on the verge of becoming the only reliable safe haven to protect against the contagion of the banking crisis.
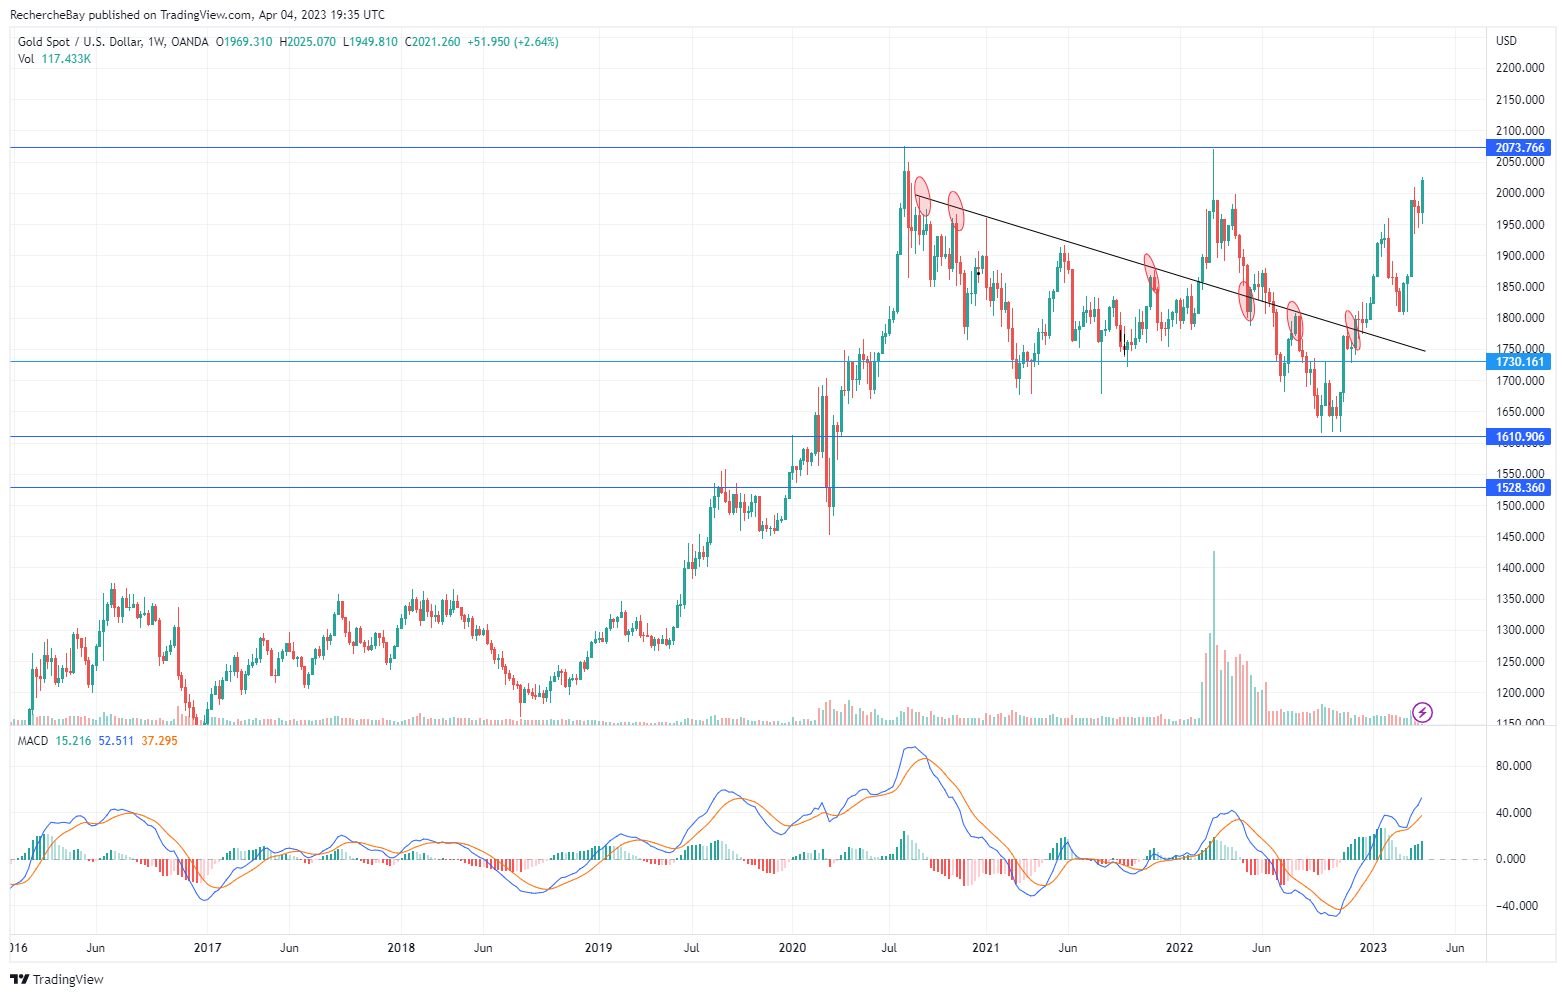
An upward break of $2,000 for gold and a downward break of $100 for TLT would send a message of panic to holders of long-term US bonds, who would then be forced to radically revise their risk management strategy."
Gold is just testing $2,000 and is heading for its all-time highs in dollars (it has already exceeded its all-time highs in all other currencies, except rubles).
(Click on image to enlarge)
The chart test of silver prices is even more significant. After missing five breakouts from its consolidation channel since the summer of 2020, silver is currently attempting a new breakout from the famous flag that it has failed to break through for the past two and a half years:
(Click on image to enlarge)
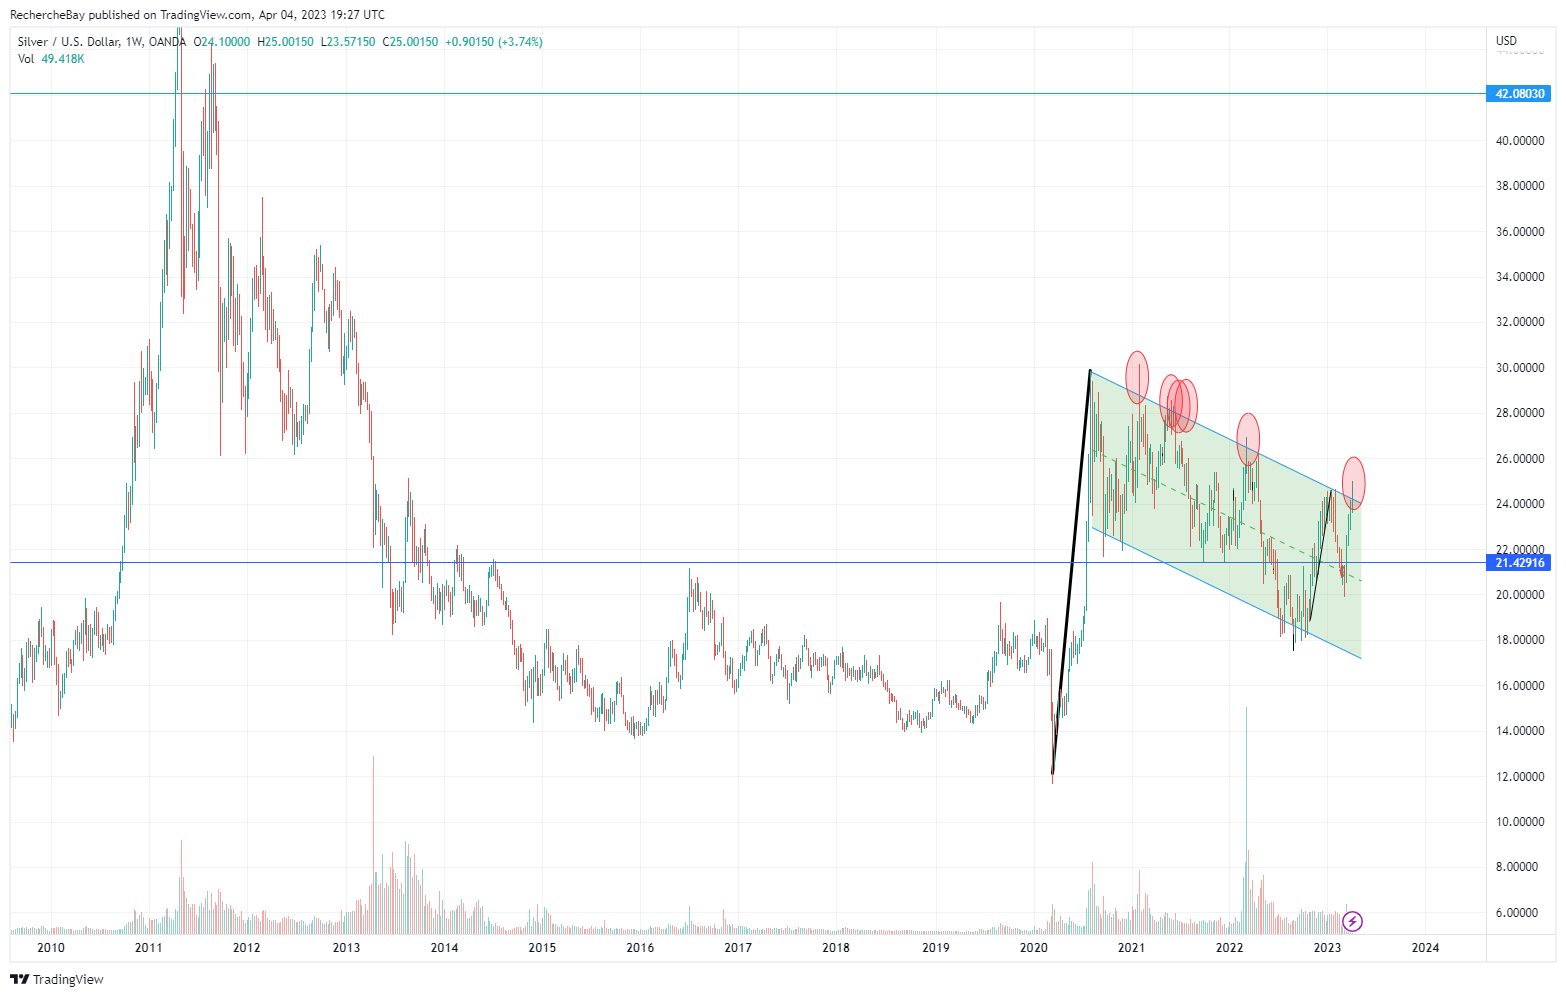
Will this sixth attempt be the right one?
The bullish impulse in silver prices is, in any case, very strong in recent weeks. The movement resembles the very bullish phases of 2010 and early 2020. Silver rises on "feverish rush". This is characteristic of a metal whose prices are highly regulated by the futures market and whose tangible underlying are under pressure.
This rise made silver the best-performing asset in March. Silver is also the asset with the largest year-to-date gain:
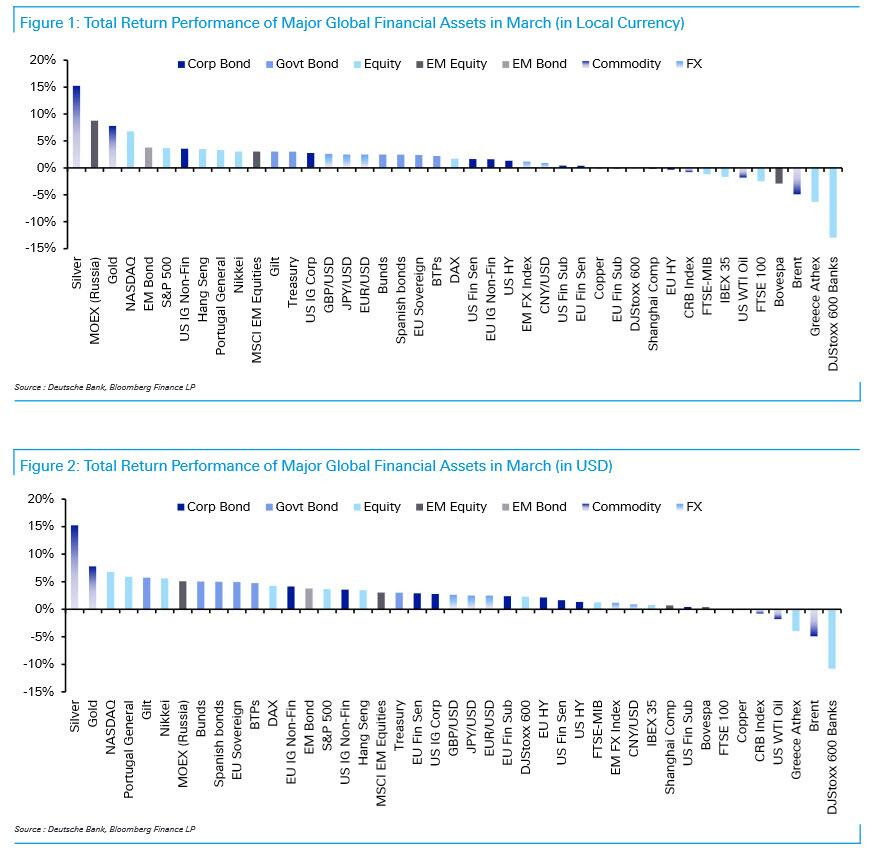
Silver is once again the best-performing asset when the banking sector goes down (conversely, bank stocks are the worst-performing assets year-to-date).
Metal is the best insurance against bank failures, as these recent figures remind us.
Graphically, in quarterly variation, silver has just drawn a strongly bullish candle (marked H on the chart below). This is quite rare on the silver chart which, since 2011, has rather accustomed us to draw quarterly bearish candles (marked B on the same chart)!
(Click on image to enlarge)
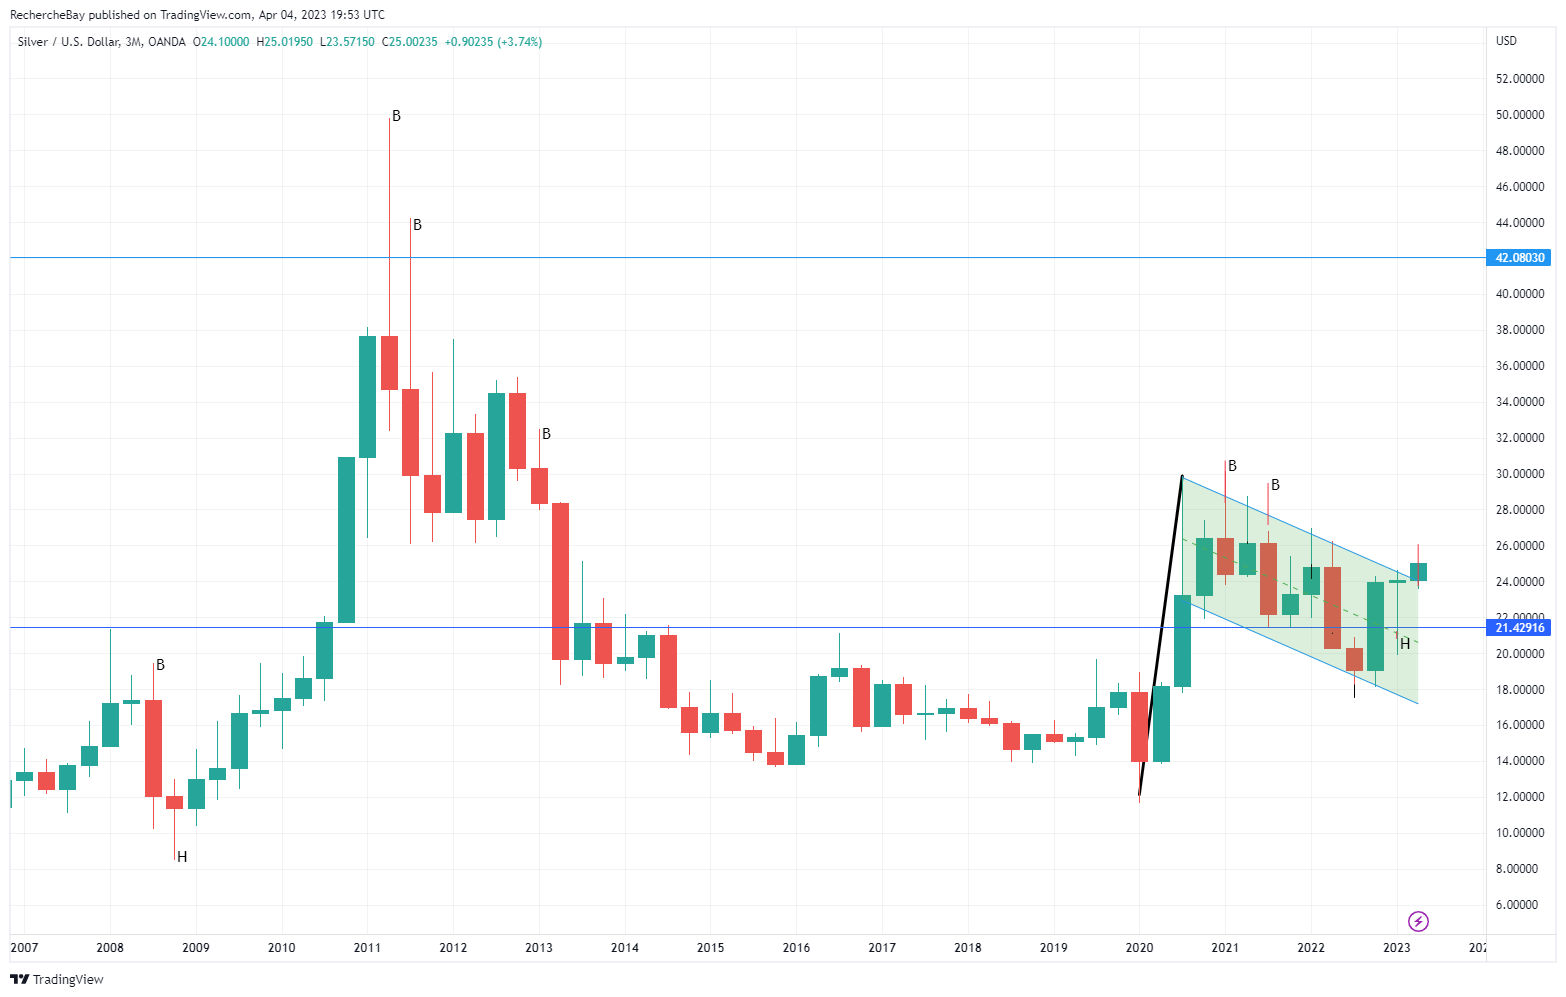
It is under the impulse of this exceptional bullish candle that silver is trying to break its famous consolidation flag, which makes us optimistic about the continuation of the rise in price.
More By This Author:
Gold Quarterly Charts Record Major Breakouts
The Concentration Of The Banking System Intensifies
What Are The Consequences Of The Banking Crisis In Europe?
Comments
Log in or sign up to join the conversation.