

Image Source: Pixabay
Yield Curve Remains Inverted, But What Happens When It Turns?
If you invest in the stock market, it’s important to pay attention to the yield curve. It’s saying the stock market could be in a precarious state, and that lots of volatility could be ahead.
Before going into any details, know that the yield curve is essentially a chart that plots the yield on bonds of various maturities. Economists follow this chart closely because it’s a powerful indictor of what’s ahead for the economy. Analysts and strategists follow it because it could tell them how stock market returns will look.
Yield curve 101: when the yields on long-term bonds are higher than the yields on short-term bonds, the yield curve is said to be “normal.” When the yields on short-term bonds are higher than the yields on long-term bonds, the curve is said to be “inverted.”
For economists, when the yield curve is inverted, it hints that the economy could be headed toward a recession. In fact, the yield curve has been one of the most accurate indicators that a recession is coming. The last few times the curve was inverted, an economic slowdown followed a few quarters later.
For analysts and strategists, whenever the yield curve goes from being inverted to normal, which is usually referred to as “steepening,” it’s followed by extreme volatility in the financial world.
How Does the Yield Curve Look Now?
For some perspective, take a look at the chart below. It plots the difference between yields on 10-year and two-year U.S. Treasury bonds.
The chart shows that the yield curve has been inverted since mid-2022. At the time of this writing, the yield curve has been inverted for 98 weeks. This is one of the longest periods on record in which the yield curve has been inverted.
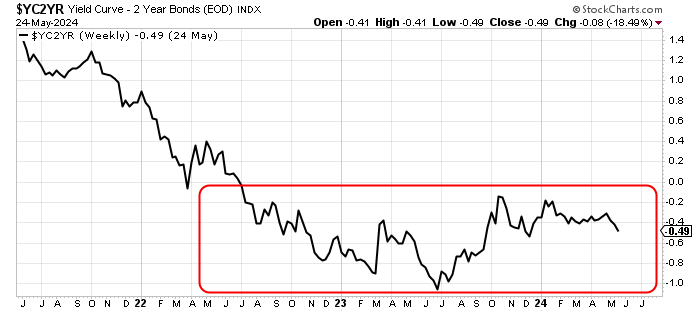
Chart courtesy of StockCharts.com
Here’s the thing, though: the yield curve will eventually go on to become normal. It always does that. It’s possible that this will happen as the Federal Reserve starts to cut interest rates.
Why? The Fed’s benchmark interest rates ultimately try to control what happens to short-term bonds, and this could change the direction of the yield curve.
Once the Yield Curve Turns, the Stock Market Crashes
What will happen to the stock market when the yield curve goes from inverted to normal? Thankfully, this phenomenon has happened a few times, so there’s a history to look at in order to help forecast how this will all play out.
Since 2000, the yield curve has gone from inverted to normal three times. Each time, the stock market put on a dire performance.
Consider this: the yield curve bottomed in 2000. Around the same time, the stock market made a top. Then, the yield curve started to steepen. Coincidentally, stock investors started to sell their shares, and a major stock market crash was at hand.
Say you held an index fund that tracked the S&P 500 between the time the yield curve bottomed in 2000 and the time it soared well above normal territory. Over that period, your investment would have gone down by about 40%.
The yield curve bottomed again in 2006. Eventually, the curve started to move higher, and by 2007, the stock market had made a definitive top. Investors again started to sell stocks as the yield curve steepened further. By September 2008, a rigorous stock market crash started.
During that time, If you had held shares of an index fund that tracked the S&P 500, your investment would have gone down by at least 30%. During the roughest period of selling on the stock market, your losses would’ve been much, much bigger.
Fast-forward to 2019: something like that happened again! It happened relatively quickly, too. The yield curve became inverted around mid-2019 and then bottomed in September of that year. The curve changed direction fairly quickly. By early 2020, the stock market had made a top. In March 2020, a severe sell-off followed.
What Should Investors Do?
I can’t stress this enough: I’m not saying we’re going to see a stock market crash tomorrow, but a possible crash is a risk that shouldn’t be overlooked, especially if interest rate cuts are on the horizon. As mentioned earlier, the yield curve has proven to be a great indicator of how stock market returns will look.
Could the pattern repeat itself? What should investors do?
I think predicting the exact market tops and bottoms is impossible. You can only tell when a bottom in the yield curve or a top on the stock market has formed once it has already happened. Betting against the market could turn out to be a horrendous trade.
I think the best strategy right now would be to be super-selective when picking investment opportunities and being careful with capital allocation. Plus, focusing on quality versus quantity would be a good idea.
If the stock market does turn, investing in high-quality companies and being careful with capital allocation could protect portfolios from severe losses.
More By This Author:
Central Banks Buy More Gold: Outlook For Gold Prices Gets ShinierChart Says Investors Are Bracing For Stock Market Crash
The Case For Stagflation In The U.S. Economy Gets Stronger


Comments
Log in or sign up to join the conversation.