Thursday, February 25, 2021 5:55 PM EDT
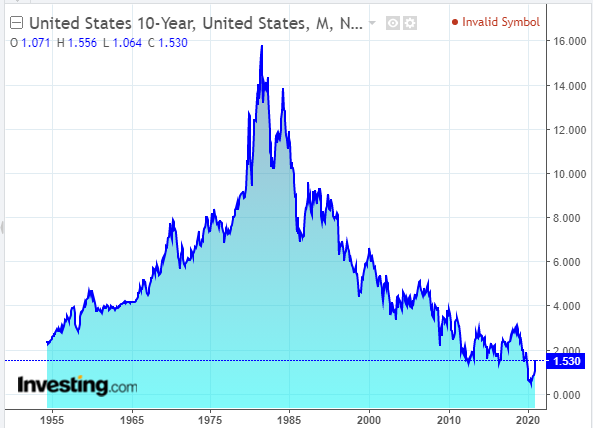
After today's gain, the US10YT now sits just above a 10-year major resistance level around 1.50%, as shown on the following monthly chart.
In the grand scheme of things (since 1955), it's still well below normal.
Upside major resistance levels/targets are 2.00% and 3.00%...but a drop and hold below 1.50% could see it return to 1.00%.
We may see it consolidate for a while before its trend becomes clearer, but currently, momentum favors buyers.
Keep an eye on the short-to-medium-term movements of the DX and the XLF for clues, as I've described here and here. A rising US dollar and a falling Financials sector may see buyers continue to support the US10YT.
Disclaimer: All of my posts (and charts) contain solely my own technical analyses/opinions/observations (which may contain errors or omissions) of a variety of markets and are ...
more
Disclaimer: All of my posts (and charts) contain solely my own technical analyses/opinions/observations (which may contain errors or omissions) of a variety of markets and are provided for your information or entertainment only...none of it may be construed as financial or trading advice. I trade my personal account only...I do not manage a fund for other people. Please do your own "due diligence" before engaging in any trading activity.
No part of my Blog may be reproduced or copied and presented as your own material.
It is the sole property of StrawberryBlondesMarketSummary.com. The sharing of my posts, is, however, permitted, as long as the appropriate credit is duly given, and as long as they remain unaltered/unedited. To share them, however, does not mean that I endorse you or the site at which you choose to share my information (although, no doubt, your intentions are honourable).
less
How did you like this article? Let us know so we can better customize your reading experience.


