
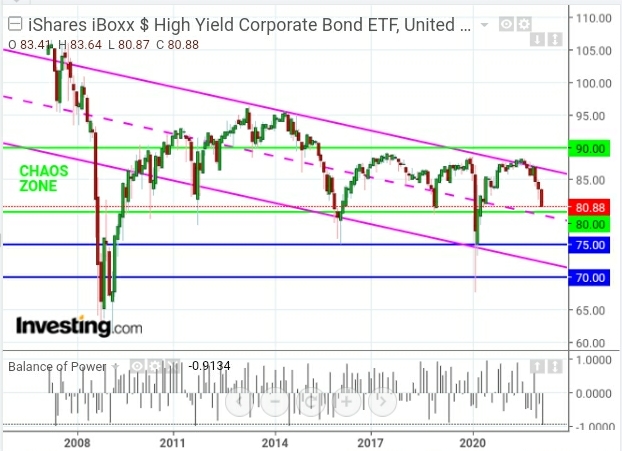
Depicted on the following monthly chart of the High Yield Corporate Bond ETF (HYG) are a long-term downtrending channel, several horizontal support and resistance levels, and a large sideways "CHAOS ZONE."
HYG's current push downward is accelerating and is fast approaching a confluence of price and channel median support around 80.00.
It has been trapped, for the most part, in a volatile and whippy "CHAOS ZONE" in between 80.00 and 90.00 since mid-2009.
A drop and hold below 80.00 on accelerating selling (depicted on the Balance of Power indicator and is now at an extreme level) could see it retest 75.00 or 70.00, or plunge even lower, in short order.
For further clues on possible direction, check out the following information.
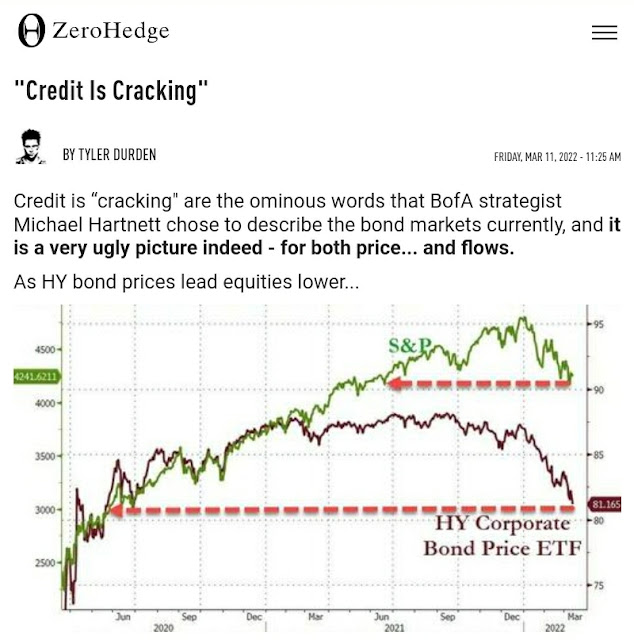
The article below contains relevant and important details on HYG and the credit markets, and their potential impacts on equity markets...definitely worth a read.


Comments
Log in or sign up to join the conversation.