Gold Price (XAU/USD) Pressing Down On Support, US Bond Yields Tick Higher
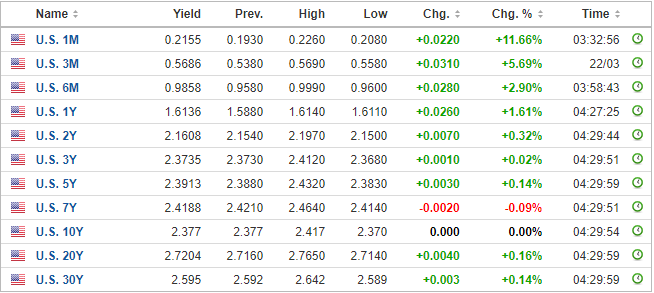
The latest, hawkish, commentary from Fed chair Jerome Powell has given US bond yields an additional boost with the interest-rate sensitive UST 2 year now offering 2.16%, its highest level in around three years. With the real possibility that the Fed hikes rates by 50 basis points at the May 5 meeting, short-dated UST yields will remain at these levels or move ever higher as the Fed accelerates monetary policy tightening.

Gold’s $2,070/oz. high on March 8 is now looking like a market aberration as sellers sold the precious metal back down to prior supportive levels. Since gold’s peak, the precious metal has posted 11 lower highs over the last 13 days, highlighting the weakness in the market. Gold seems to have settled either side of $1,916/oz. and old swing high from June 1 2021 and just below the 61.8% Fibonacci retracement level of the August 2020/August 2021 rally at $1,920/oz.
A break and open below $1,916/oz. will leave bears looking at a zone between $1,870/oz. and $1,877/oz. based on the 50% Fibonacci retracement and the November 16 swing high. The 20-day simple moving average is now acting as resistance, while the 50-day sma lies at $1,893/oz.
Gold Daily Price Chart – Wednesday, March 23
(Click on image to enlarge)

Retail trader data show 78.47% of traders are net-long with the ratio of traders long to short at 3.64 to 1. The number of traders net-long is 1.25% lower than yesterday and 9.86% higher from last week, while the number of traders net-short is 2.41% lower than yesterday and 12.54% lower from last week.
We typically take a contrarian view to crowd sentiment, and the fact traders are net-long suggests Gold prices may continue to fall. Traders are further net-long than yesterday and last week, and the combination of current sentiment and recent changes gives us a stronger Gold-bearish contrarian trading bias.
What are your views on Gold – bullish or bearish?
Disclosure: See the full disclosure for DailyFX here.


