
FOMC Hikes By 50 Bps, Announces Balance Sheet Taper
Yesterday the FOMC raised the Fed funds rate by half a percentage point, disappointing some that anticipated 75 basis points; and announced the planned trimming of its balance sheet starting in June with a cap of $47.5 billion worth of treasuries and mortgage bonds to roll off in June, July and August which will then be increased to $95 billion thereafter.
The market reaction was one of hawkish disappointment or often referred to as a ‘relief rally’ as ‘long dollar plays’ eased off, allowing temporary gains in the pound, euro, treasury bonds, stocks, and gold. The US dollar has been surging, driven by aggressive rate hike expectations, rising treasury yields, and its safe-haven appeal during the Ukraine invasion.
Gold’s Bearish Longer-term Fundamental Outlook
During the period of excess accommodation and near-zero interest rates, gold thrived as the non-interest-bearing commodity capitalized on low-interest rates and economic fears surrounding the pandemic, and more recently, the war in Ukraine. With interest rates now at 0.75% - 1%, the opportunity cost of holding gold wanes and this becomes particularly apparent when we consider Powell’s comments that multiple 50 bps hikes in the upcoming meetings seem appropriate and the committee will do whatever is appropriate to bring inflation back towards the target (2% over the medium term).
Gold’s Key Technical Levels
Gold has continued its upward momentum as yesterday’s daily close confirmed the formation of a morning star candlestick pattern – a common bullish reversal pattern. Prices are higher this morning, raising the question of how high gold could go. Interestingly enough we are trading near the pre-war level of 1908 but technically this carries little significance. The most immediate hurdle is the psychological level of 1900 and then the significant 1915 level of resistance (prior support for March and early April), followed by the 61.8% Fib at 1923 (2020 high to 2021 low move).
Support comes in at 1878 followed by the 1854/52 prior low.
Daily Gold Chart
(Click on image to enlarge)
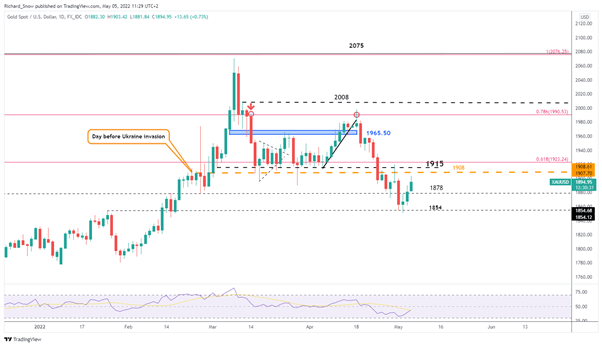
Source: TradingView, prepared by Richard Snow
The 10 and 2 year treasury yields, alongside a weaker dollar, helped spur on gold yesterday although, yields have turned higher this morning, signaling that gold upside may begin to encounter some near-term resistance.
Daily Treasury Yields (2yr and 10 year)
(Click on image to enlarge)
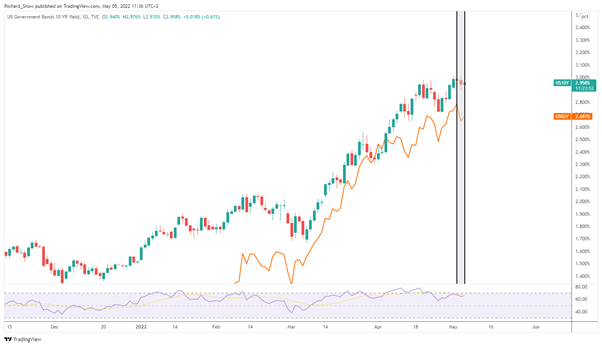
Source: TradingView, prepared by Richard Snow
Taking into consideration the bearish fundamentals for gold over the longer term, it would make sense to view historical price action via the monthly chart for perspective. 1854 appears to be the major level whereby gold could drop into a bearish trend. It supported gold prices earlier this month and has set the bar for longer-term bearish momentum. A break below 1854 could open up a long-term move towards the zone of support around 1760.
Monthly Gold Chart
(Click on image to enlarge)
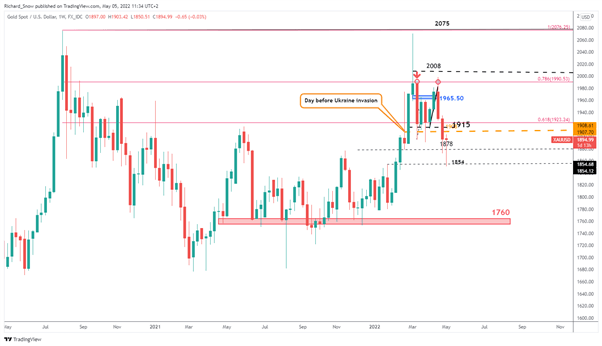
Source: TradingView, prepared by Richard Snow


Comments
Log in or sign up to join the conversation.