
While the week was full of drama, the Fed and the implications of its future monetary policy was the most important fundamental development to hit the newswire.
For example, the FOMC announced a 25 basis point rate hike on Mar. 16, and the median projection (the five dots below) is for six more rate hikes in 2022 (seven in total). Moreover, with six meetings left on the FOMC’s 2022 schedule, it implies consecutive rate hikes for the next several months.
Please see below:
(Click on image to enlarge)
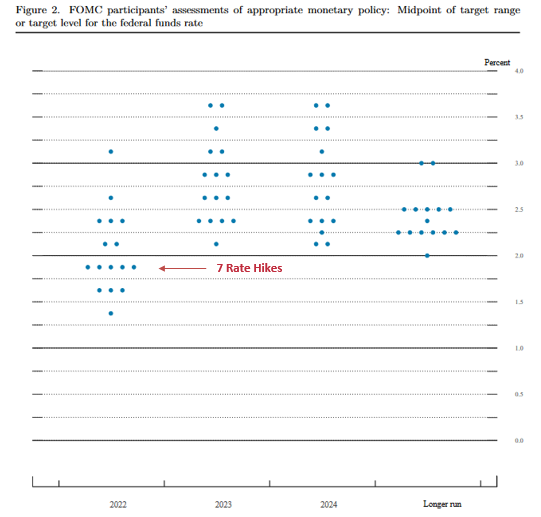
Source: U.S. Fed
Moreover, with FOMC officials’ median estimate increasing from three rate hikes in December to seven rate hikes in March, the hawkish ante has been upped with every new release of their Summary of Economic Projections (SEP).
However, while the developments are fundamentally bullish for the USD Index and U.S. Treasury yields, the PMs are behaving as if none of that matters. Moreover, with the Russia-Ukraine conflict distracting gold, silver, and mining stocks from domestic fundamental realities, their recent strength is a function of momentum, not medium-term technicals or fundamentals.
To explain, I spent a lot of time covering the S&P Goldman Sachs Commodity Index (S&P GSCI) this week and noted that it could act as the fundamental canary in the coal mine.
For context, the S&P GSCI contains 24 commodities from all sectors: six energy products, five industrial metals, eight agricultural products, three livestock products, and two precious metals. However, energy accounts for roughly 54% of the index’s movement.
Furthermore, with the index rising and falling sharply in a matter of days, the PMs have been along for the ride. However, with the International Energy Agency (IEA) lighting a fire under crude on Mar. 17, it released a report outlining the potential shortfall of Russian oil in April. It stated:
“The prospect of large-scale disruptions to Russian oil production is threatening to create a global oil supply shock. We estimate that from April, 3 mb/d of Russian oil output could be shut in as sanctions take hold and buyers shun exports. OPEC+ is, for now, sticking to its agreement to increase supply by modest monthly amounts. Only Saudi Arabia and the UAE hold substantial spare capacity that could immediately help to offset a Russian shortfall.”
With financial markets all about expectations, the potential for a shortfall sent WTI 6.95% higher on Mar. 17.
Please see below:
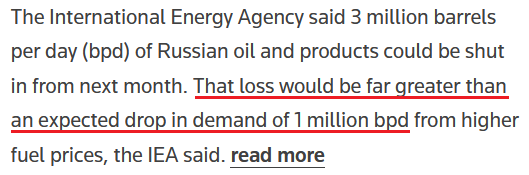
Source: Reuters
Moreover, since energy accounts for roughly 54% of the S&P GSCI’s movement and momentum beget momentum, the PMs are borrowing optimism and ignoring fundamentals. However, the short-term phenomena will likely result in sharp drawdowns over the medium term.
Please see below:
(Click on image to enlarge)
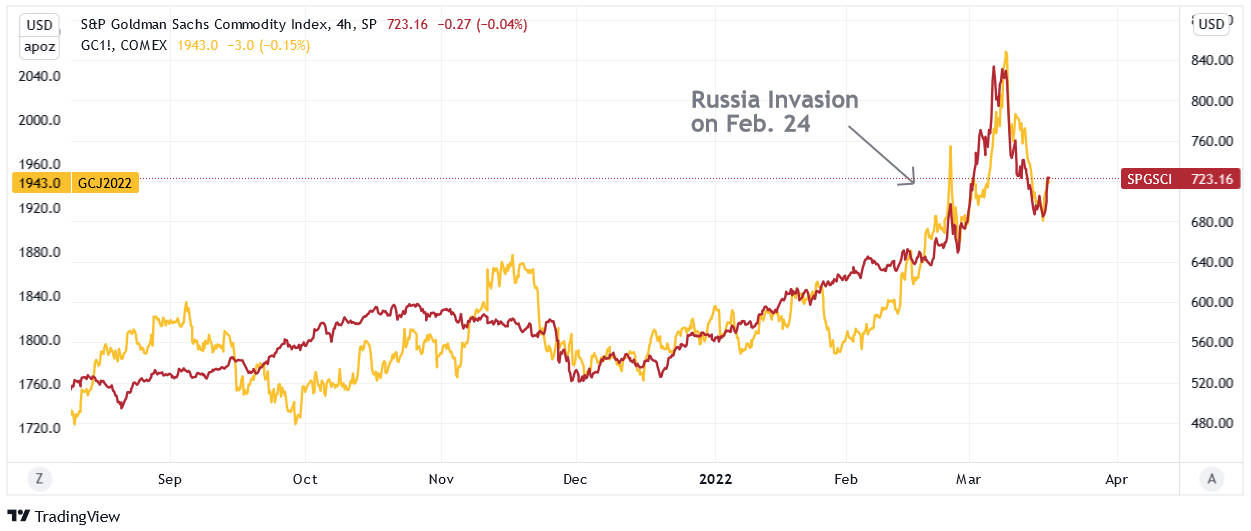
To explain, the red line above tracks the four-hour movement of the S&P GSCI, while the gold line above tracks the gold futures price. If you analyze their behavior before Russia invaded Ukraine, you can see little to no connection.
However, if you focus your attention on the price action since the Feb. 24 invasion, you can see that it’s become one trade. Moreover, the weak fundamental outlook that caused gold to underperform the S&P GSCI in early 2022 has only intensified since the Fed meeting. However, despite that, momentum investors are following the trend, and rallies in crude are sparking rallies in the metals.
As a result, the PMs’ rallies on Mar. 17 were more about momentum. However, with their medium-term fundamentals heading in the opposite directions, sharp drawdowns should materialize once the ‘all-for-one’ trade unwinds.
To that point, while the PMs may assume that the Fed won’t follow through on its hawkish forecast, the reality is that the U.S. economic outlook is bullish for hawkish Fed policy.
To explain, I wrote on Mar. 9:
(Click on image to enlarge)
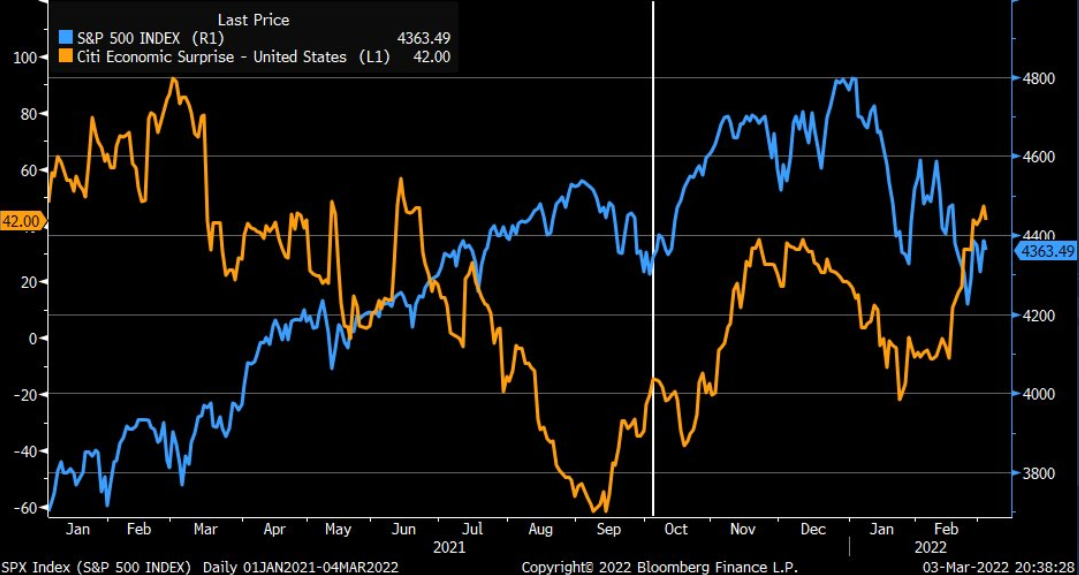
The blue line above tracks the S&P 500, while the orange line above tracks Citigroup’s Economic Surprise Index. For context, a surprise occurs when an economic data point outperforms economists’ consensus estimate.
If you analyze the right side of the chart, you can see that the orange line bottomed in January and has been moving higher ever since. As a result, the U.S. economy remains in a healthy position, and as long as this is the case, it keeps the pressure on the Fed to raise interest rates at its next several monetary policy meetings.
To that point, with more data released on Mar. 17, the outperformance continued.
Please see below:
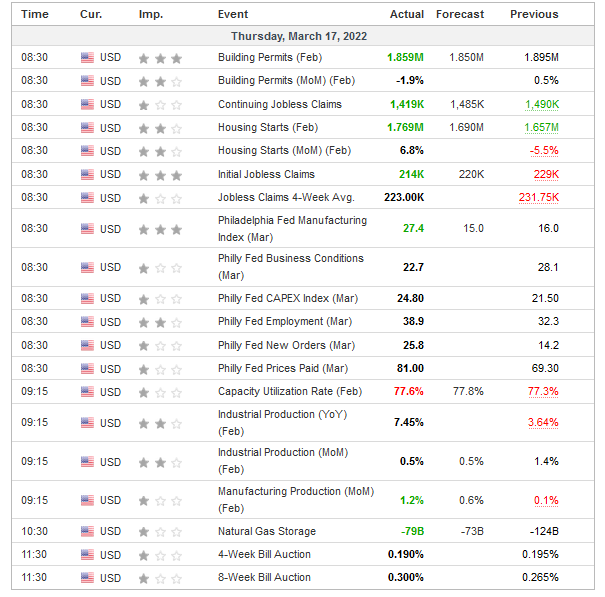
Source: Investing.com
The U.S. Economy Condition
To explain, building permits, housing starts, manufacturing production, initial and continuing jobless claims, and the Philadelphia Fed’s manufacturing index all outperformed expectations on Mar. 17. As a result, they add upward momentum to Citigroup’s Economic Surprise Index. Moreover, with the Fed’s hawkish disposition dependent on the health of the U.S. economy, Thursday’s data only enhances the prospects of more rate increases.
For example, I wrote on Mar. 17: Powell noted during his press conference that there are ~1.7 job openings for every unemployed U.S. citizen. He added that “all signs are that this is a strong economy, one that will be able to flourish in the face of less accommodative monetary policy.”
Moreover, with continuing jobless claims hitting a new post-pandemic low on Mar. 17, the Fed’s maximum employment mandate remains on the hawkish side of the spectrum.
Please see below:
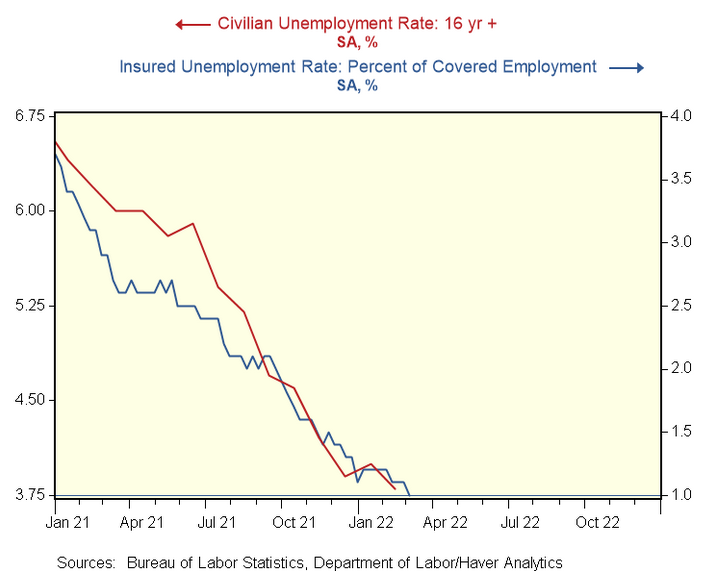
To explain, the red line above tracks the civilian unemployment rate, while the blue line above tracks the insured unemployment rate. For context, the latter calculates the number of U.S. citizens collecting unemployment as a percentage of the U.S. labor force. Moreover, the metric dropped to 1% on Mar. 17 highlights how U.S. labor market strength should keep the Fed’s foot on the hawkish accelerator.
Second, I also noted on Mar. 17 that the critical development is Powell’s view of the U.S. economy. In a nutshell: if Powell believes the U.S. economy is in a healthy position, then he’ll raise interest rates until he no longer thinks that’s the case. With his remarks on Mar. 17 signaling more hawkish policy to come, the PMs should suffer the consequences over the medium term.
Please see below:
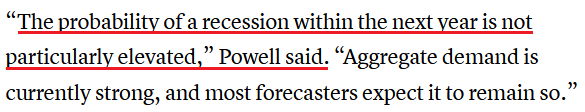
Source: CNBC
In addition, I noted above that U.S. housing started outperforming expectations on Mar. 17. With the metric hitting a new 2022 high of 1.769 million, the data supports Powell’s assertion that the U.S. economy is nowhere near a recession.
Please see below:
(Click on image to enlarge)
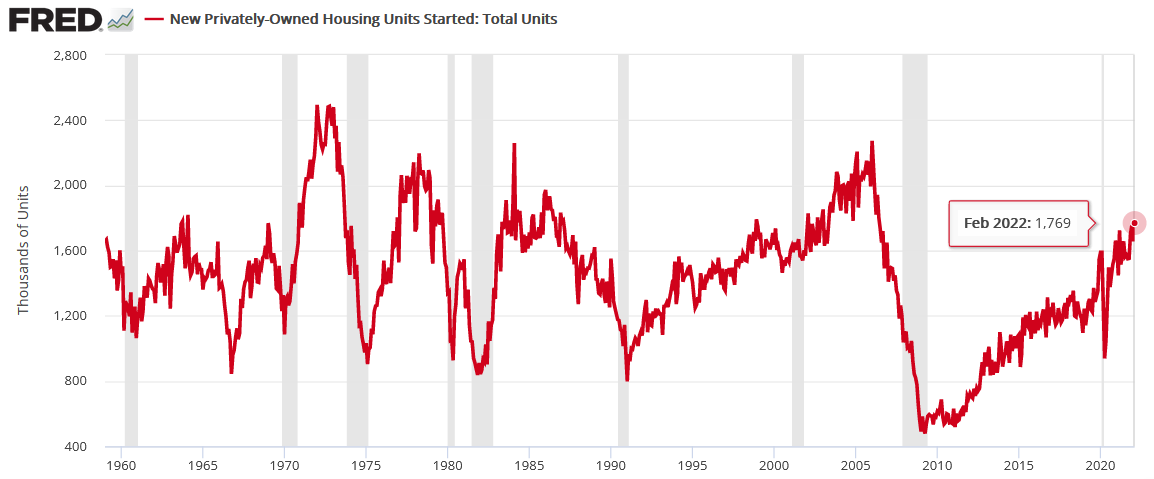
To explain, the red line above tracks U.S. housing starts, while the gray bars above track U.S. recessions. If you analyze the connection, notice how U.S. housing starts always peak and decline in advance of U.S. recessions. Moreover, the relationship has been present since before 1960. As a result, with U.S. housing starting hitting a new post-pandemic high on Mar. 17, it adds more fuel to the Fed’s hawkish fire.
On top of that, while inflation remains extremely problematic, the latest survey data shows that pricing pressures are still headed in the wrong direction. For example, I noted above how the Philadelphia Fed’s manufacturing index outperformed expectations on Mar. 17. Well, the report also stated that “price increases become more widespread:”
“The prices paid index climbed 12 points to 81.0, it is highest reading since June 1979. More than 87 percent of the firms reported increases in input prices, while 6 percent reported decreases; 7 percent of the firms reported no change. The current prices received index increased 5 points to 54.4. Nearly 57 percent of the firms reported increases in prices received for their own goods this month, 2 percent reported decreases, and 38 percent reported no change.”
Please see below:
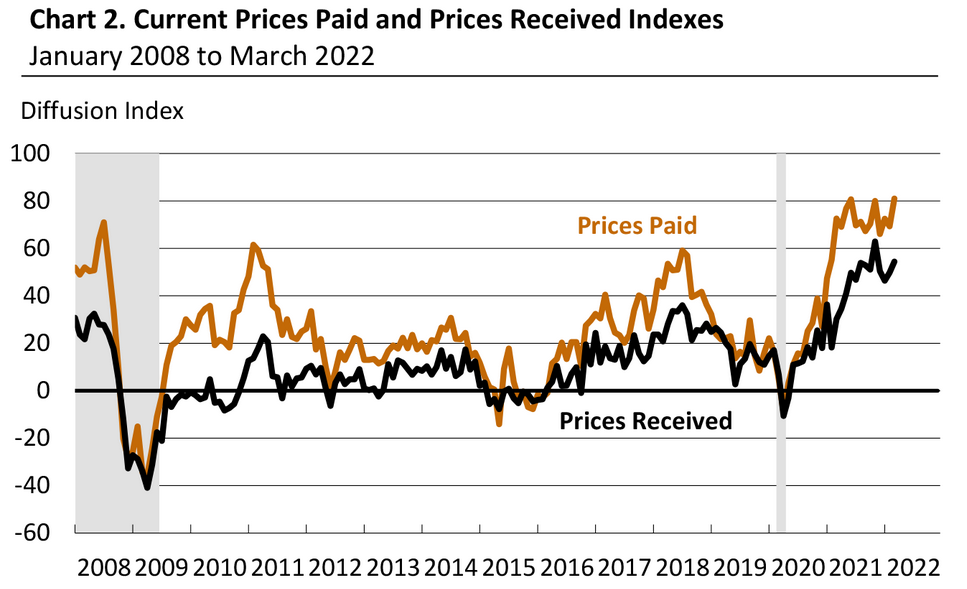
Source: Philadelphia Fed
Similarly, the New York Fed’s Empire State Manufacturing Index was released on Mar. 15. The report revealed:
“The prices paid index edged down three points to 73.8, while the prices received index rose two points to a record high of 56.1, signaling ongoing substantial increases in both input prices and selling prices.”
Please see below:
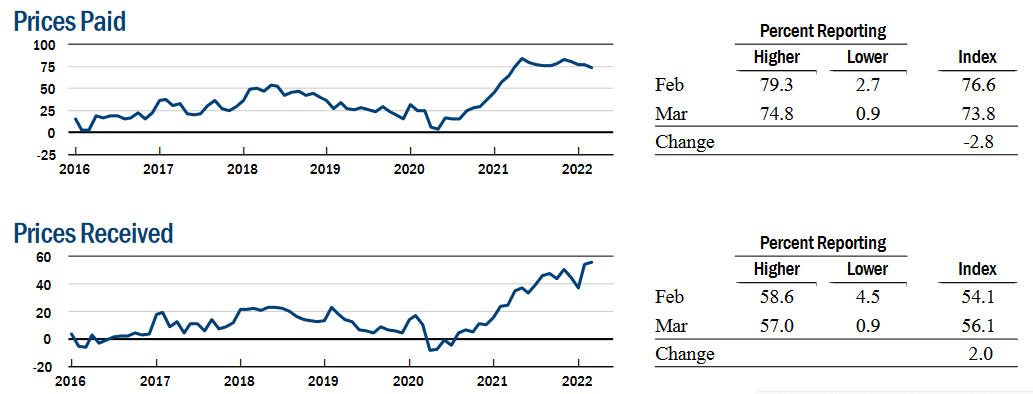
Source: New York Fed
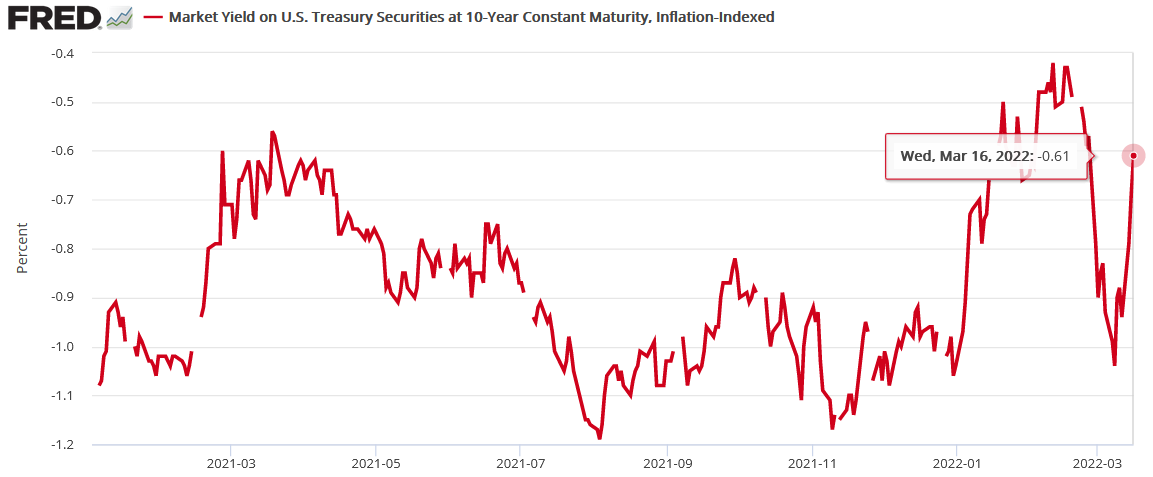
Finally, while the Russia-Ukraine conflict resulted in a safe-haven bid for U.S. Treasuries, that gambit has already unraveled. In the process, the sharp decline in the U.S. 10-Year real yield has also reversed, and with even higher real yields required to calm inflation, the PMs will likely regret dismissing all of these fundamental warning signs.
(Click on image to enlarge)
The bottom line? While it was an eventful week on the fundamental front, the realized data only strengthened the PMs' bearish thesis. For months I've been warning that surging inflation and a resilient U.S. economy would elicit a hawkish shift from the Fed. Moreover, with each monetary policy meeting and each SEP release, the Fed continues to increase its hawkish directives. As a result, while the PMs seem inclined to ignore these developments right now, history implies that the tranquility won't last.
What to Watch for Next Week
With another full slate of U.S. economic data releases next week, the most important ones are as follows:
- Mar. 22: Richmond Fed manufacturing and services indexes
With output and inflation metrics providing insight into the state of play in March, it will be interesting to see if the data mirrors the results from the New York and Philadelphia Fed’s manufacturing surveys.
- Mar. 23: New home sales
With housing starts and building permits outperforming expectations on Mar. 17, new home sales will tell us how consumers are reacting to U.S. mortgage rates that have increased sharply amid the rise in U.S. Treasury yields.
- Mar. 24: Durable goods orders, ISM and IHS Markit PMIs, the KC Fed manufacturing index
More comprehensive than the regional surveys (like New York, Richmond, Philadelphia, KC, etc.), the ISM and IHS Markit PMIs cover the entire U.S. As a result, the readings on output, employment, and inflation are the most important data points of the week.
- Mar. 25: Michigan consumer sentiment, pending home sales
Like in prior months, it will be interesting to see how consumers respond to higher oil prices, higher mortgage rates, and the overall inflationary environment. In addition, pending home sales will piggyback on the implications of the other housing data.
All in all, economic data releases impact the PMs because they impact monetary policy. Moreover, if we continue to see outperformance alongside higher employment and inflation, the Fed will need to push up real yields to reduce demand and calm the pricing pressures. If that occurs, the outcome is profoundly bearish for the PMs.


Comments
Log in or sign up to join the conversation.