
THE YIELD CURVE IS CYCLICAL
Like all markets, the treasury market is highly cyclical. The yield curve undulates from steep to flat as the underlying economic environment waxes and wanes. Determining where we are in the economic cycle is difficult, but the yield curve can help investors make tactical adjustments to their overall portfolio allocations and make an educated guess as to where we are in the economic cycle. Currently, the yield curve is very flat, meaning short-term treasury rates are comparable or even higher than longer-term treasury rates. A flat/inverted yield curve is a typical indication that we are in the latter part of the economic cycle. More importantly, a flat/inverted yield curve does not usually persist for long.
Below is a framework for fixed-income investing based on the yield curve. But before I explain the chart below, a few definitions may help:
Bear Flattening – Short-term yields move higher and faster than long-term yields as the Federal Reserve hikes
Bull Flattening – Long-term yields move lower and faster than short-term yields as the market prices in slower growth and inflation
Bull Steepening – Short-term yields move lower and faster than long-term yields as the Federal Reserve cuts rates to stimulate growth during an economic slowdown
Bear Steepening – Longer-term rates move higher and faster than short-term rates as the market prices in faster growth and higher inflation
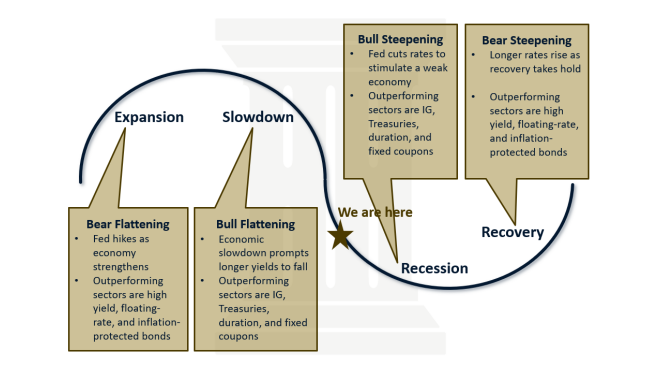
Currently, I believe we are on the precipice of a bull steepening episode as the Federal Reserve reacts to deteriorating economic fundamentals. The Federal Reserve has already cut the benchmark Fed Funds rate 50 basis-points in 2019. Jay Powell has referenced this as a “mid-cycle” adjustment. However, the fixed income market is pricing in an additional two rate cuts by the end of the year. As such, I view the most recent cuts as the beginning of a cycle rather than a simple “adjustment.” Recent macroeconomic data is confirming this thesis. Manufacturing is likely already in a Recession as Manufacturing PMI surveys are all sub-50 – the Maginot-Line between expansion and contraction. Last week’s Service PMI gauge, although above 50, has weakened substantially over the last year, and consumer confidence and small business optimism are all deteriorating. I expect consumption in the U.S. to continue to weaken in the near-term – how much it weakens will determine the depth of the ensuing recession, which at this point, I expect to be shallow. Nevertheless, the Fed will react by continuing to cut short-term rates, perhaps accelerating the rate of cuts in 2020. As a result, I expect the yield curve to steepen. Recall, we had a bear flattening episode from late 2015 to late 2018 as the Federal Reserve methodically hiked. They stopped hiking earlier this year, and a bull flattening episode ensued as the treasury market rapidly priced-in slowing growth. The ten-year and thirty-year yields are currently challenging their all-time lows. Bull Steepening would be the next logical yield curve paradigm.
WHAT DO YOU DO IN A BULL STEEPENING ENVIRONMENT?
Before I explain the performance chart below, a couple more definitions may be of assistance:
Bear Bull Flattening – Short-term yields move higher, and longer-term yields move lower
Bear Bull Steepening – Short-term yields move lower, and longer-term yields move higher
Both of these occurrences are relatively rare and generally occur when the market perceives that the Federal Reserve has gone too far in its hiking/cutting cycle.
The following chart shows the average monthly performance for various indices in differing yield curve environments since 2001. As you can see risk-assets such as equities and high-yield tend to do well in bear steepening and bear flattening episodes (Economic Recovery and Expansion in the last chart).
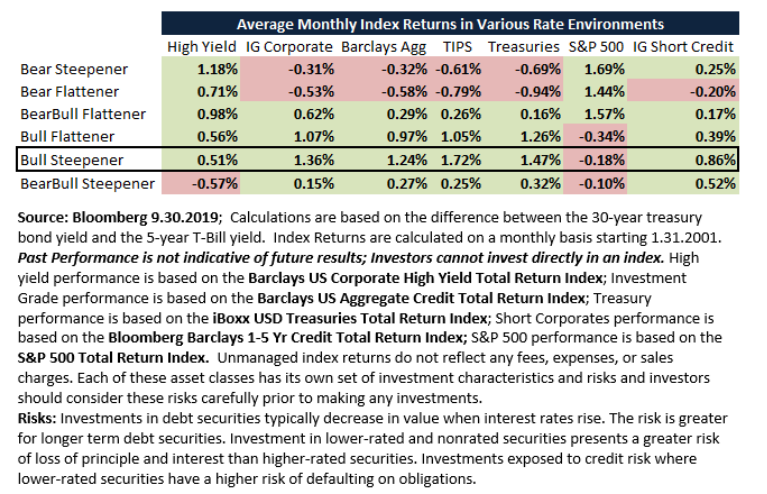
Meanwhile, treasuries and investment-grade corporates tend to do poorly in this environment. The opposite is true in a bull steepener environment. In general, a bull steepening environment is a tailwind for most fixed income indices – the exception being high yield which has historically underperformed when the Fed is in a rate-cutting cycle. This makes sense since, during these episodes, the Fed is reacting to deteriorating fundamentals and a weak earnings environment. Short-duration investment-grade corporate bonds perform better in a bull-steepening episode than in any other yield curve environment. Given their lower duration, and the Fed tailwind, they offer a very good risk-reward proposition in this environment. Other fixed-income subsectors that are typically eschewed in a rate-cutting cycle are Senior Bank Loans and Collateralized Loan Obligations, both of which have lower credit ratings (on the collateral in the CLO’s) and have floating coupons which generate less yield as shorter-term rates fall. We recommend paring back high yield exposure, increasing credit quality, adding to fixed-coupon exposure over floating-rate, and investing in corporate bonds whose coupons adjust based on the steepness of the yield curve. We have made these tactical adjustments in the Holbrook Income Fund as we have a conviction that we are about to experience a bull-steepening environment.
A QUICK NOTE REGARDING DURATION
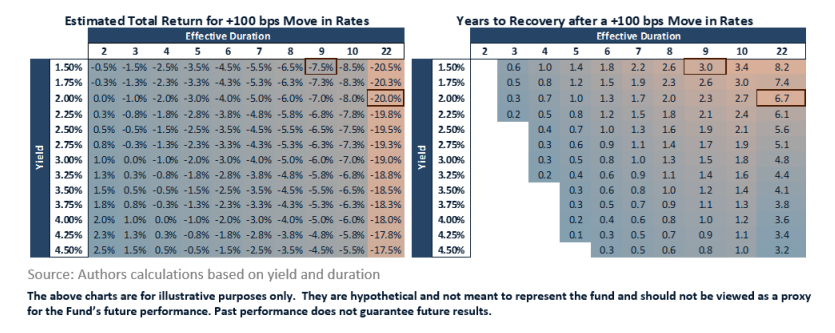
Historically, a bull-steepening environment has been a tailwind for bonds that have long duration. However, we are cautious on duration despite the expectation that economic weakness will persist in the near-term. First, we could always be wrong about where we are in the cycle, and if growth were to accelerate, longer-term bonds, given their duration and low yields, could perform poorly. Secondly, even if the economy weakens, we think that inflation could be more robust than in the past few economic cycles, which could also pose a risk to longer-term bonds. And finally, we believe longer-term yields are very correlated to global rates. A pick-up in the Eurozone and Japanese economies could induce in a rate spike. The hypothetical chart below shows the risks of owning long-duration bonds. A 100-basis point move in a bond that has an effective duration of 22 years and a 2% yield would result in a 20% loss, and it would take 6.7 years to recoup that loss with coupons alone. It is a risk-reward proposition that we don’t recommend.
Index Performance Supplement:
Barclays US Corporate High Yield Total Return Index - The Index measures the USD-denominated, high yield, fixed-rate corporate bond market. Securities are classified as high yield if the middle rating of Moody’s, Fitch and S&P is Ba1/BB+/BB+ or below. Bonds from issuers with an emerging markets country of risk, based on Barclays EM country definition, are excluded. The US Corporate High Yield Index is a component of the US Universal and Global High Yield Indices. The index was created in 1986, with history backfilled to July 1, 1983.
Barclays US Aggregate Credit Total Return Index - The Barclays US Credit Index measures the investment grade, US dollar-denominated, fixed-rate, taxable corporate and government-related bond markets. It is composed of the US Corporate Index and a non-corporate component that includes foreign agencies, sovereigns, supranational and local authorities. The US Credit Index was called the US Corporate Index until July 2000, when it was renamed to reflect its inclusion of both corporate and non-corporate issuers. The US Credit Index is a subset of the US Government/Credit Index and US Aggregate Index. Index history is available back to 1973.
Markit iBoxx TIPS Inflation-Linked Nominal Total Return Index – Index tracks the performance of TIPS Inflation-Linked securities calculated in USD. The total return is calculated in nominal terms. The index history starts on December 31, 2000
iBoxx USD Treasuries Total Return Index – The Index tracks the total return of U.S. treasuries with maturities greater than one year.
Barclays U.S. Aggregate Total Return Index - The Barclays US Aggregate Bond Index is a broad-based flagship benchmark that measures the investment grade, US dollar-denominated, fixed-rate taxable bond market. The index includes Treasuries, government-related and corporate securities, MBS (agency fixed-rate and hybrid ARM pass-throughs), ABS and CMBS (agency and non-agency).
Bloomberg Barclays 1-5 Year Credit Total Return Index– The index is a broad market performance benchmark that includes all medium and larger issues of U.S. investment-grade corporate bonds that have maturities of between 1 and 5 years and are publicly issued. S&P 500 Total Return Index – Performance of the S&P 500 including reinvested dividends
Risks:
Investments in mutual funds involve risk including possible loss of principal. There is no guarantee that any investment strategy will achieve its objectives, generate profits, or avoid losses. The Fund invests in closed-end investment companies or funds. The shares of many closed-end funds, after their initial public offering, frequently trade at a price per share that is less than the net asset value per share, the difference representing the "market discount" of such shares. The Fund may be adversely affected by new (or revised) laws or regulations that may be imposed by government regulators or self-regulatory organizations that supervise the financial markets. CLO debt securities are limited recourse obligations of their issuers and may be subject to redemption. Holders of the CLO debt being redeemed will be repaid earlier than the stated maturity of the debt. The timing of redemptions may adversely affect the returns on CLO debt. The CLO manager may not find suitable assets in which to invest during the Reinvestment Period or to replace assets that the manager has determined are no longer suitable for investment.
The value of securities issued by the U.S. Government generally fluctuates in response to inflationary concerns and may differ in their interest rates, maturities, times of issuance and other characteristics. The risk that the Fund could lose money if the issuer or guarantor of a fixed income security is unwilling or unable to make timely payments to meet its contractual obligations. The risk that foreign currencies will decline in value relative to the U.S. dollar and adversely affect the value of the Fund’s investments in foreign (non-U.S.) currencies. The derivative instruments in which the Fund may invest for hedging purposes may be more volatile than other instruments. The Fund invests in fixed income securities or derivatives, the value of your investment in the Fund will fluctuate with changes in interest rates. These risks could affect the value of a particular investment by the Fund. Investment in or exposure to high yield (lower rated) debt instruments (also known as “junk bonds”) may involve greater levels of interest rate, credit, liquidity and valuation risk than for higher-rated instruments. When the Fund invests in other investment companies, including ETFs, it will bear additional expenses.
The Fund has a limited history of operation. In addition, the Adviser has not previously managed a mutual fund. The risk that investment strategies employed by the Fund’s adviser in selecting investments for the Fund may not result in an increase in the value of your investment. The Adviser’s use of computer trading modeling systems may perform differently than expected as a result of the factors used in the models.
Comments
Log in or sign up to join the conversation.