
Fed Ends Quantitative Tightening (QT) - What Happened Last Time?

Photo by Anne Nygård on Unsplash
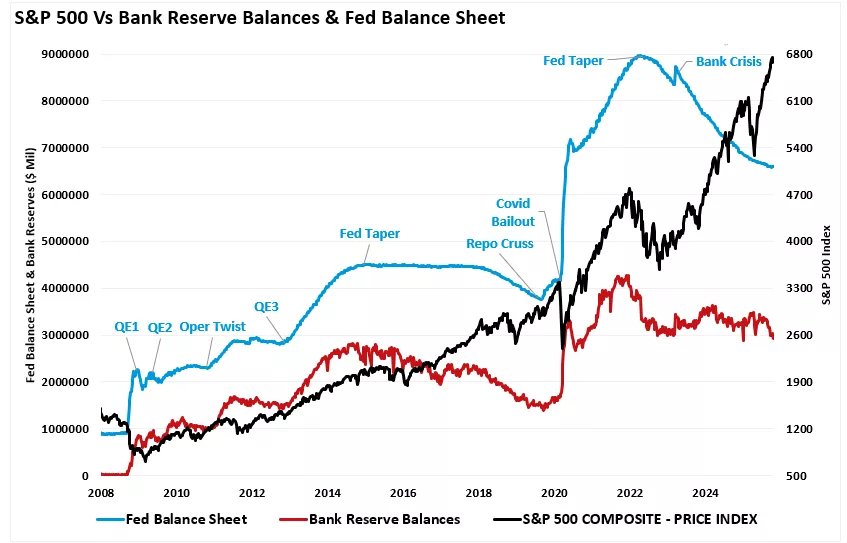
The Fed’s latest QT cycle officially ended on December 1, 2025. Over 3.5 years, the balance sheet shrank by ≈ $2.2 trillion (now ~$6.7T).
This is only the second real QT in history: • 2017–2019: Cut ~$700B then slammed the brakes when repo markets freaked out.
Historical Pattern After QT Ends
Stopping the liquidity drain is almost always bullish for risk assets… at least for a while.
2019 playbook (QT ended Aug/Sep 2019):
→ S&P 500: +12% rally in just 5 months
→ 10-year Treasury yield: Dropped from ~1.7% to under 1.0% → bond prices ripped higher
→ Gold: Jumped +15% in a few months (loves lower real yields)
→ Oil & commodities: Choppy and sideways… until COVID sent them off a cliff
The 2019 party lasted ~5 months before an outside shock (COVID) killed the vibe.
Fast-forward to today: QT is done again (Dec 2025), and markets are once more sniffing a fresh liquidity tailwind — as long as no new shocks show up.
More By This Author:


