Fed Balance Sheet: Too Little Too Late
Breaking Down the Balance Sheet
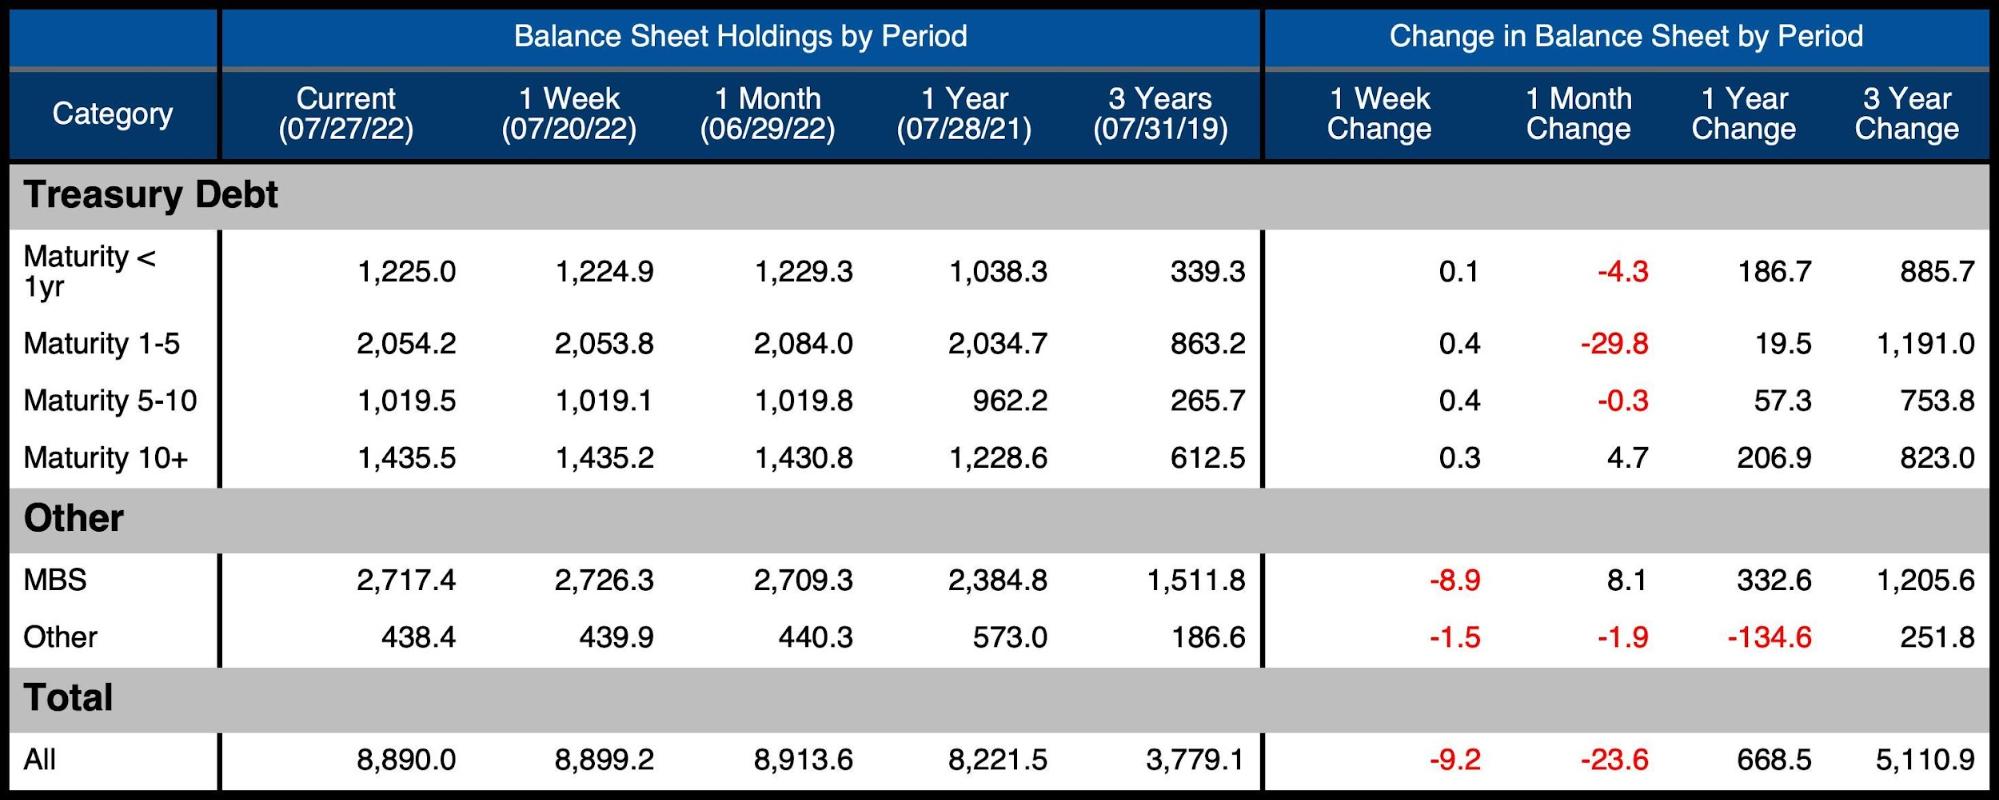
Another month shows the Fed still struggling to implement Quantitative Tightening (QT). According to the Fed, they should be shrinking the balance sheet by at least $47.5B a month, spread between $30B in Treasuries and $17.5B in MBS.
In the latest month, Treasuries did shrink by $29.7B, very close to the target. That being said, MBS increased by $8B, which was a big miss.
Figure: 1 Monthly Change by Instrument
The table below details the movement for the month:
- Nearly all the decline in Treasuries happened in Maturity of 1-5 years.
- This could have added more pressure on inverting the yield curve.
- The total balance sheet contracted by $23.6B
- Over the last two months, the balance sheet has fallen by $25B vs a target of $95B.
Figure: 2 Balance Sheet Breakdown
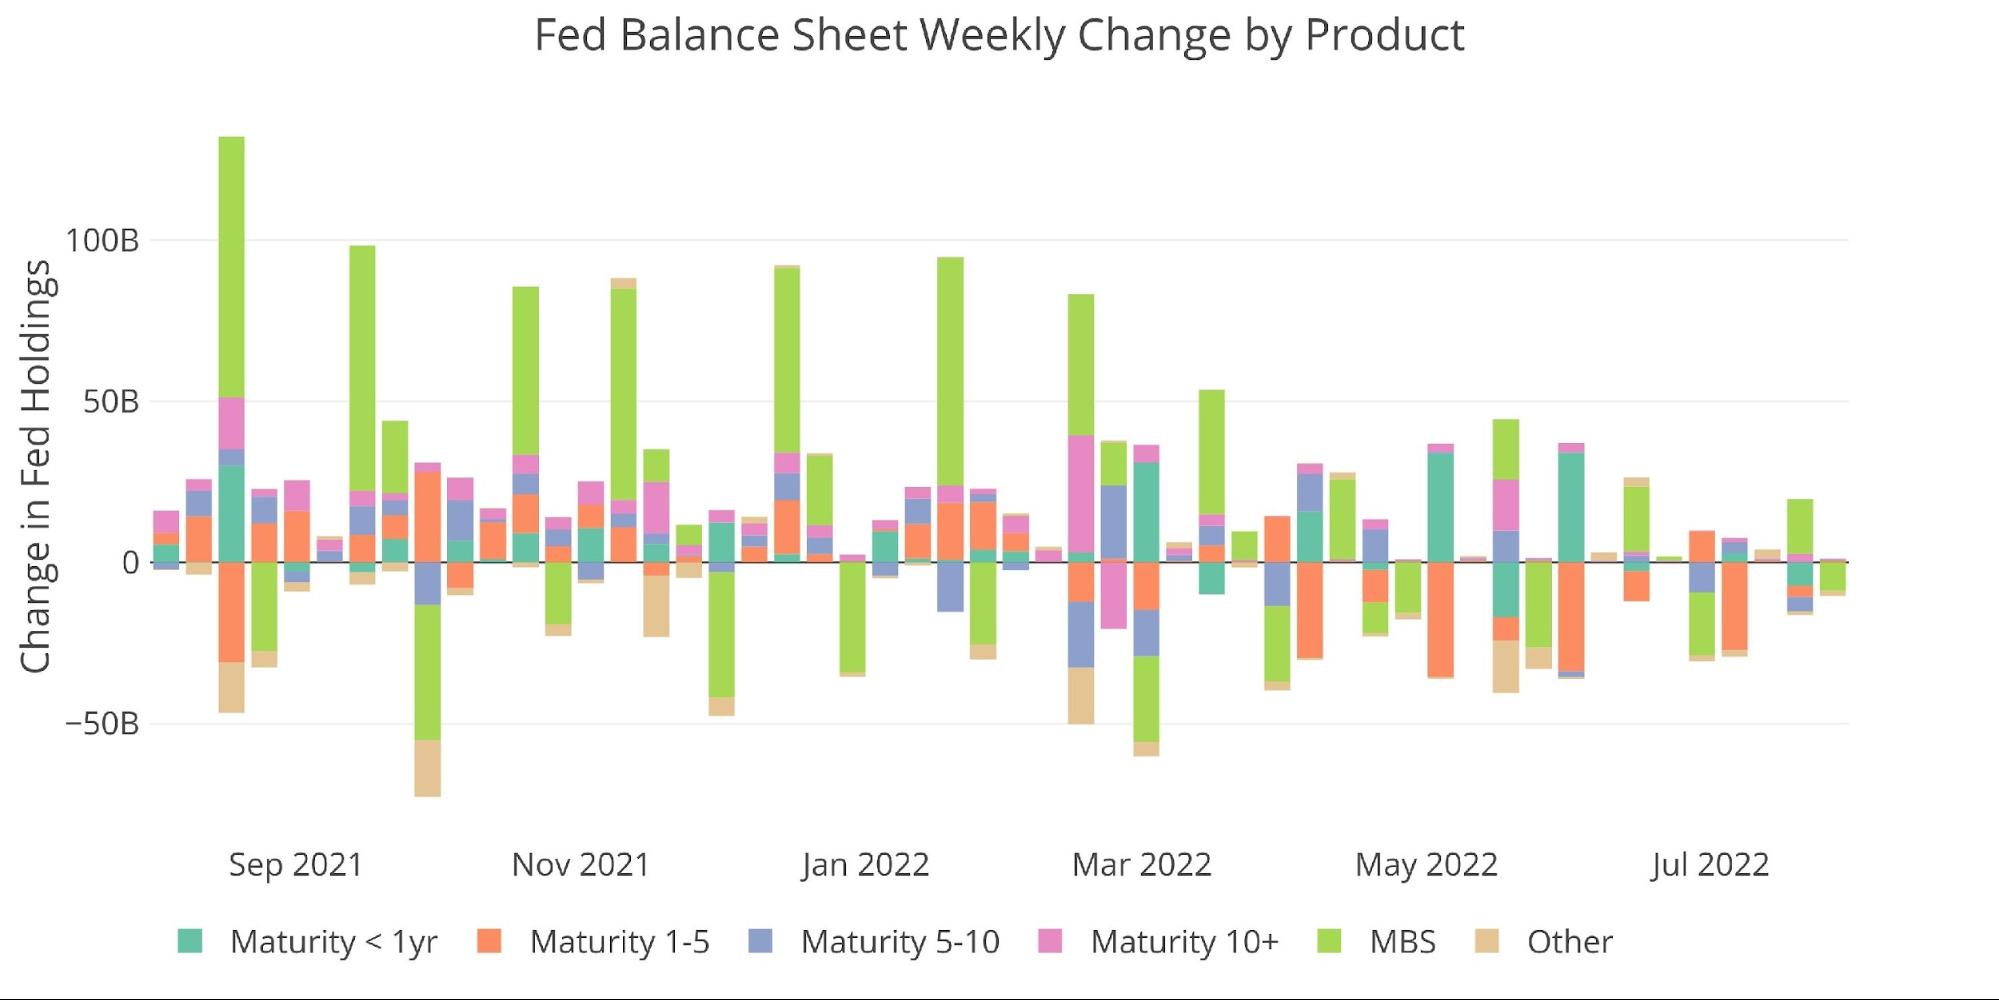
Looking at the weekly data shows that reductions in Treasuries have mainly been in the 1-5 year maturities for several months. There is some action in <1yr and 5-10 year, but the major contractions are happening in 1-5 year.
Figure: 3 Fed Balance Sheet Weekly Changes
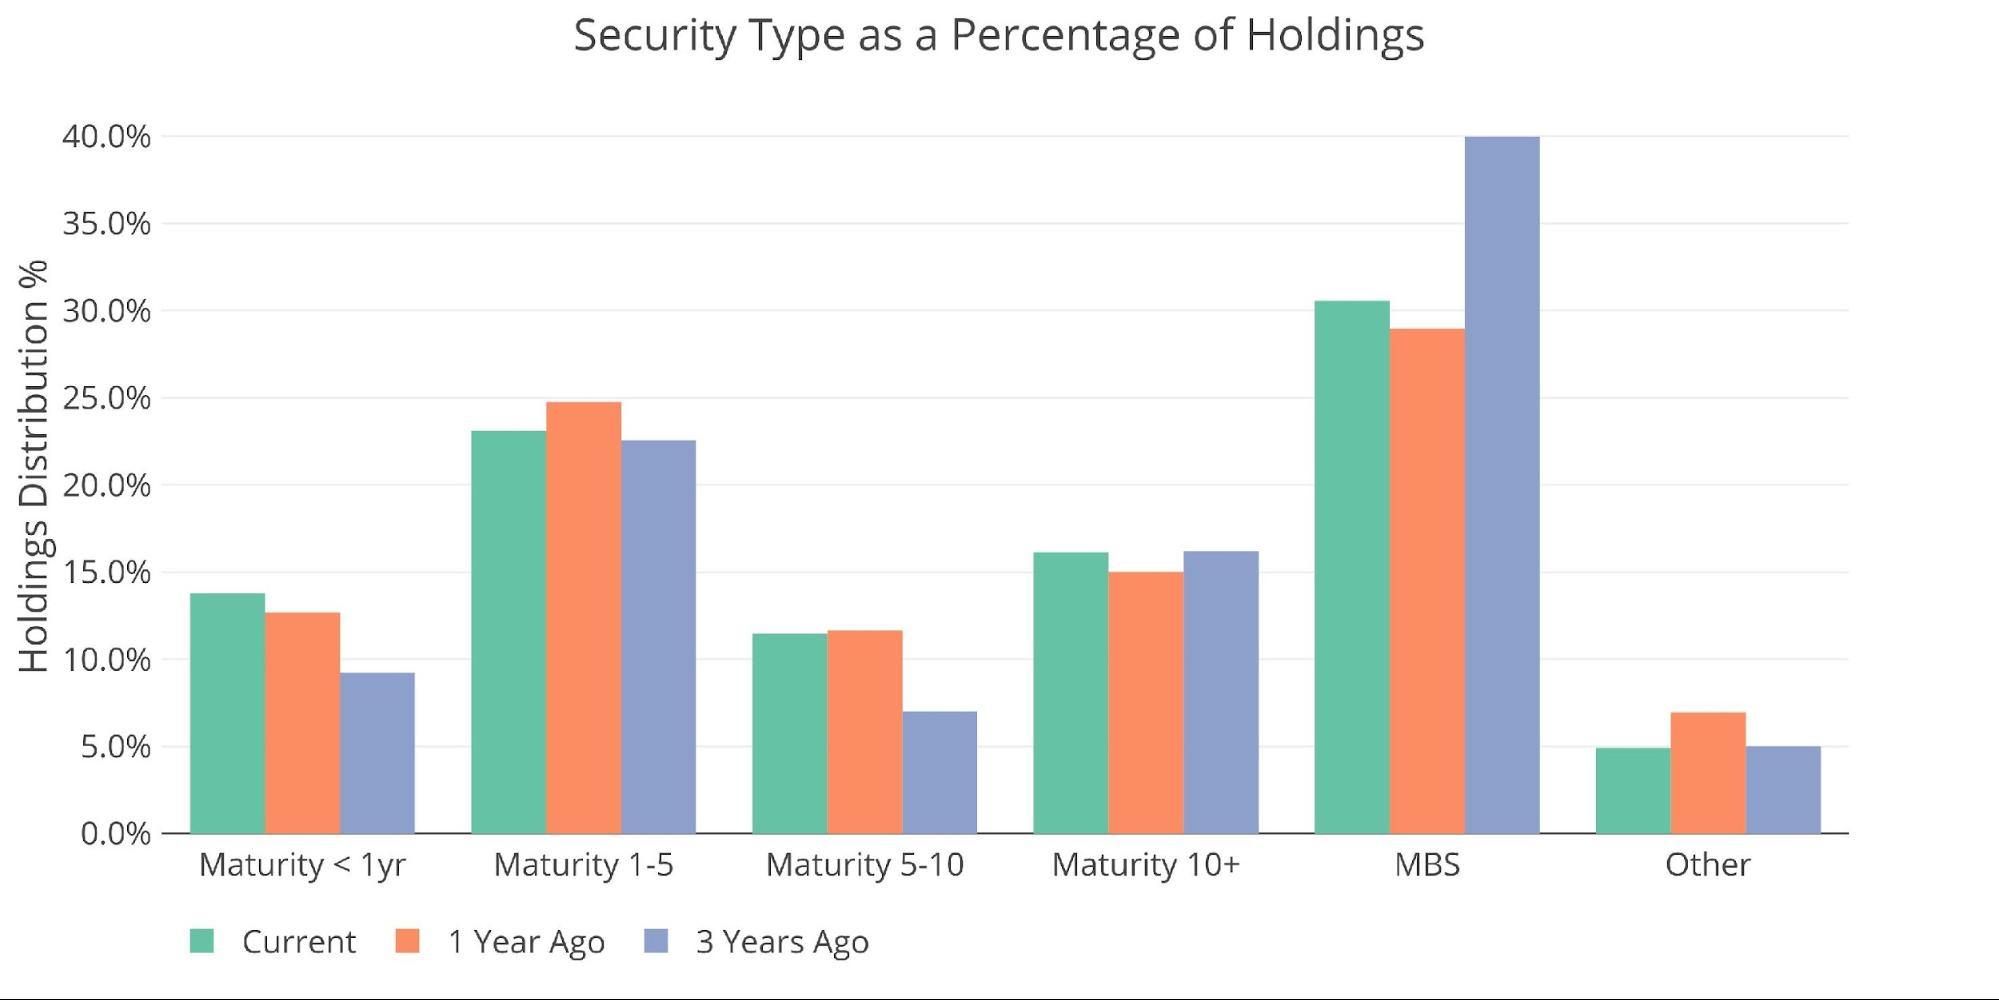
This has led to some changes in the distribution of holdings on the Fed balance sheet. MBS is down from pre-covid levels but up over the last year, reaching 30.6% in the most recent period. Maturity at less than 1 year has grown and now stands at 13.8%. Finally, the selling of 1-5 years has had an effect, though somewhat minimal. In the last year, holdings have fallen from 24.8% to 23.1%.
Figure: 4 Total Debt Outstanding
The Fed has promised to increase the pace of asset reduction in the months ahead. This will likely further change the distribution of holdings, assuming they get around to it. Even before QT really started, there has been a massive slowdown in Money Supply which is causing major damage across the economy leading to a plunge in consumer confidence and tanking the housing market.
On Thursday the Fed raised rates by another 75bps and reiterated its commitment to Quantitative Tightening. However, as the economy continues to deteriorate, the Fed may find little room to maneuver. If they decide to pause in the months ahead, QT will likely end before it even gets started.
The Fed was relatively aggressive with rate hikes, getting in as many as possible before the recession comes. Unfortunately, the Fed did not do the same with QT. The best chance at reducing the balance sheet without causing significant harm was likely many months ago. The upcoming reductions will be too little too late to have any meaningful impact on reducing the bloated Fed balance sheet.
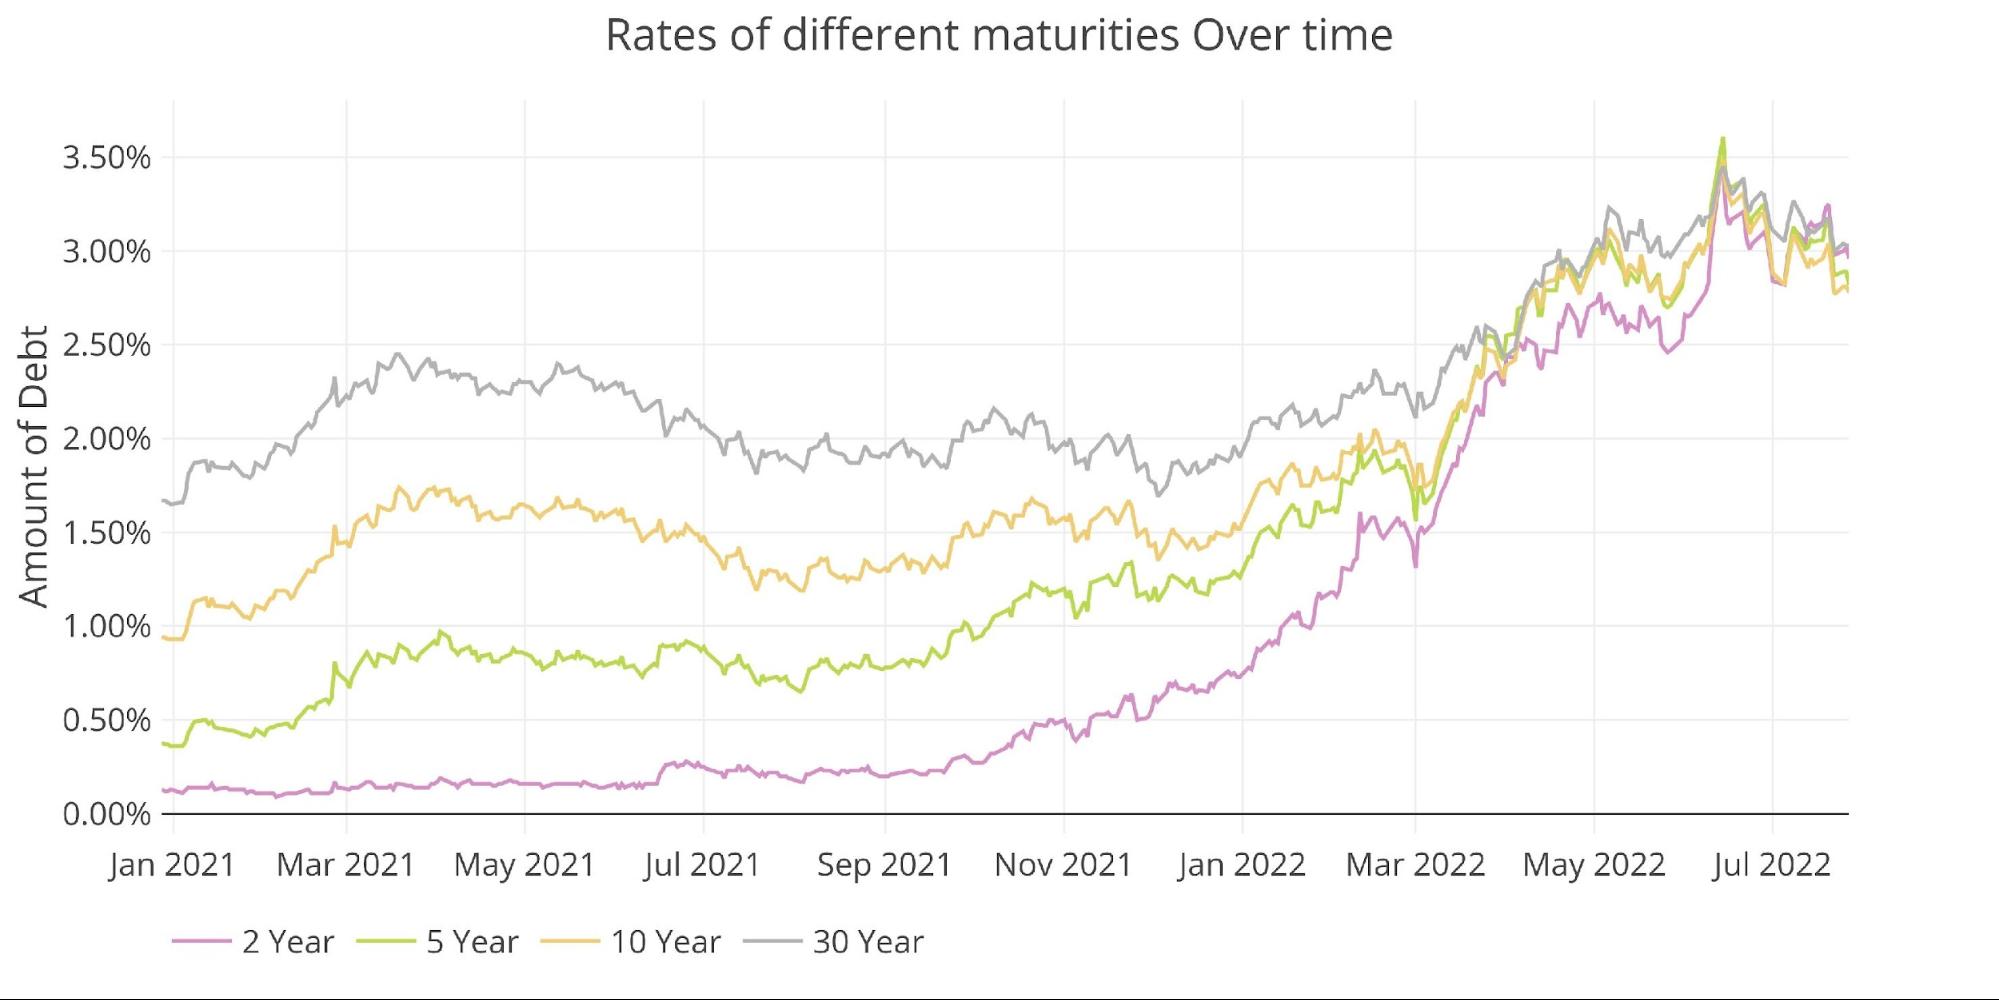
Never mind reducing assets, the Fed’s mere exit from increasing their balance sheet is already being felt in the bond market with massive congestion in the yield curve as seen below.
Figure: 5 Interest Rates Across Maturities
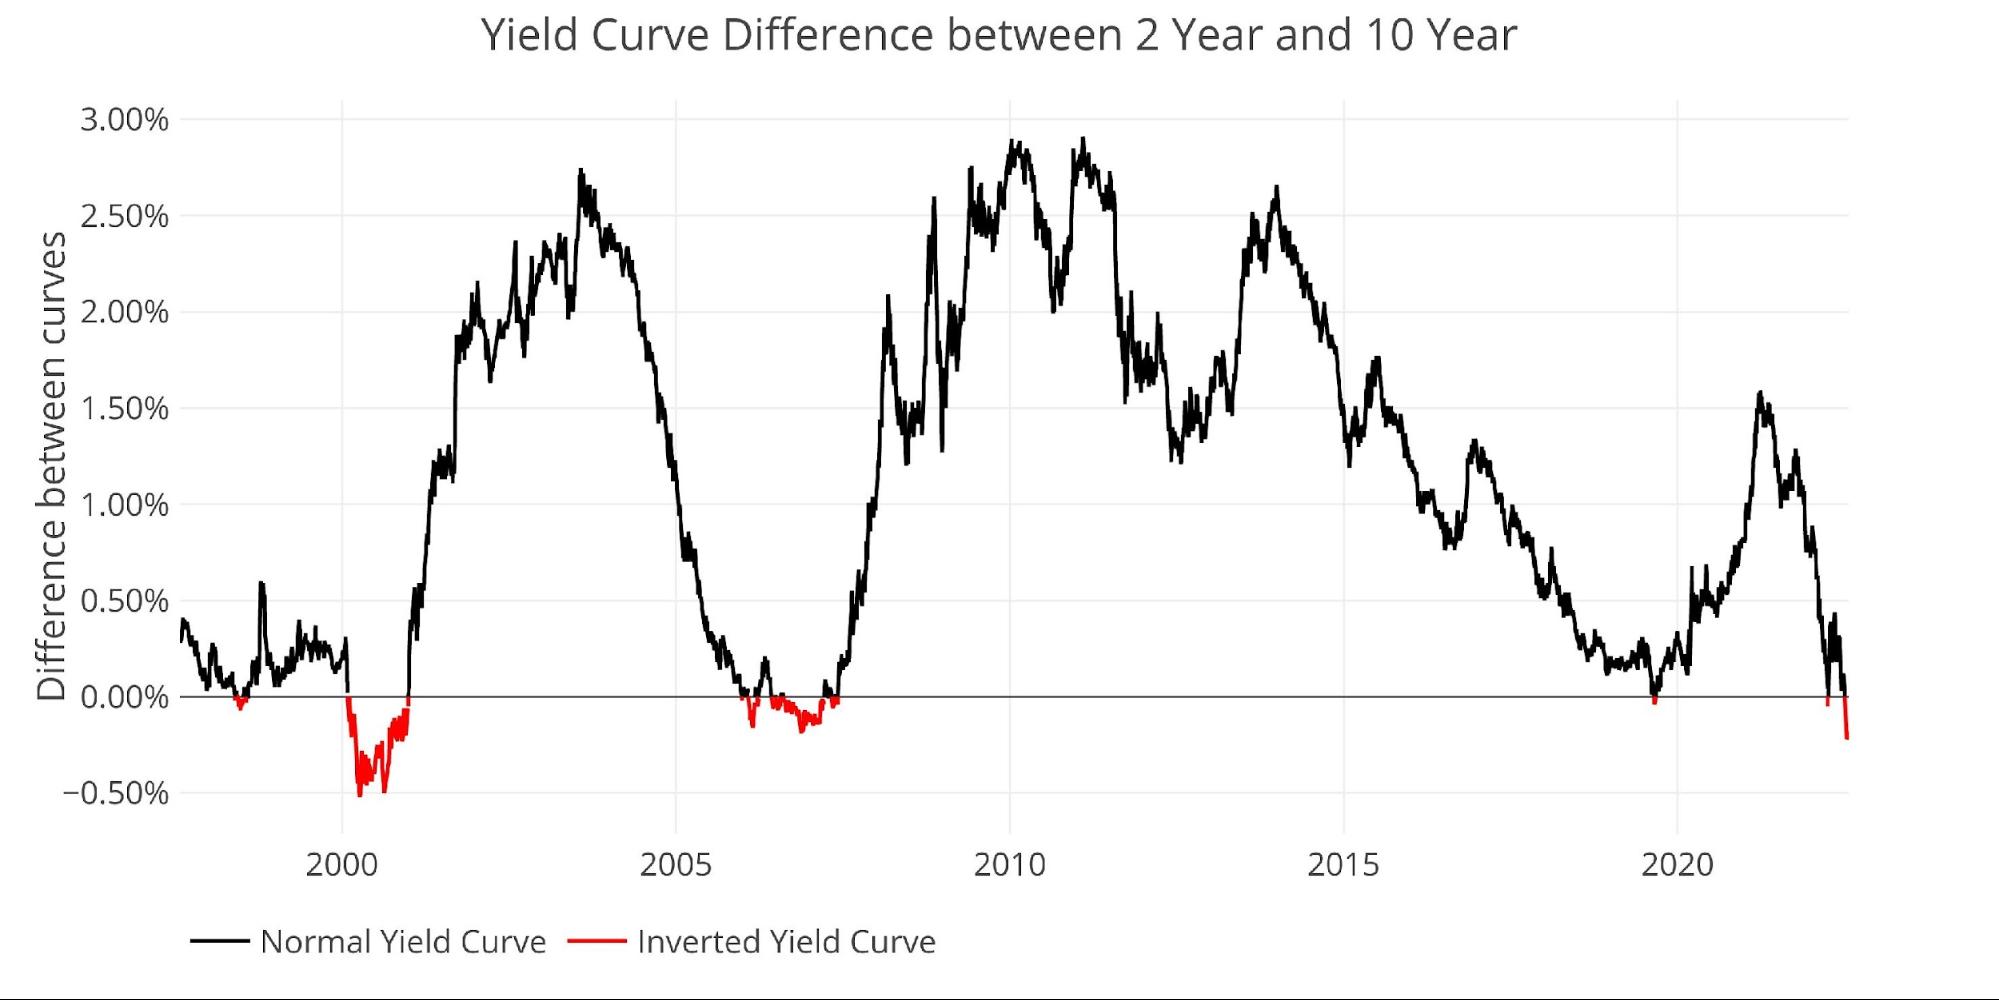
In fact, the yield curve has been inverted for almost all of July. As the chart below shows, the current inversion is greater than at any time in the lead-up to the 2008 Financial Crisis. The market is clearly pricing in a recession. Even though the White House has changed the definition of recession, the US economy did officially enter a technical recession back in January as confirmed Thursday with the first reading of Q2 GDP at -0.9%.
Figure: 6 Tracking Yield Curve Inversion
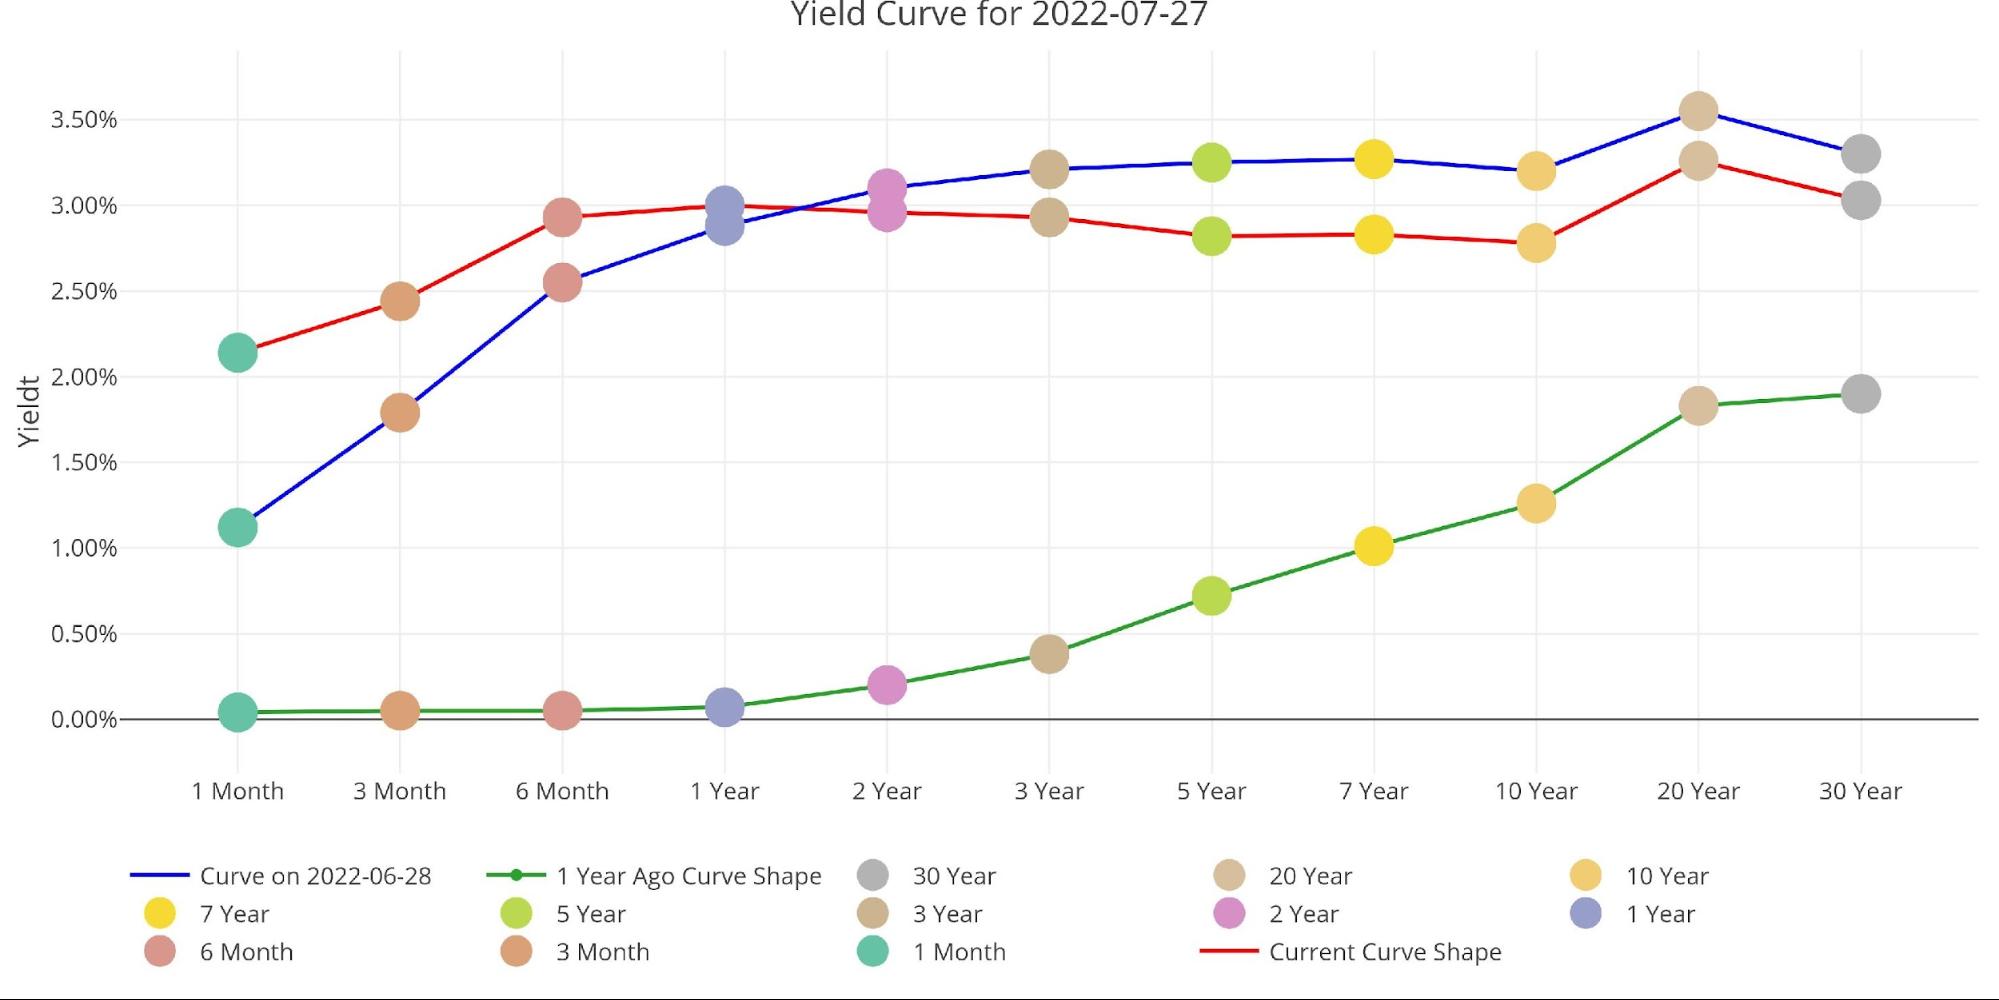
Looking at the entire yield curve shows how much has changed over the last month and year. Last month shows a flat but non-inverted yield curve. This month shows a clear inversion whereas last year shows a very normal upward sloping curve, albeit with very low rates.
Figure: 7 Tracking Yield Curve Inversion
Who Will Fill the Gap?
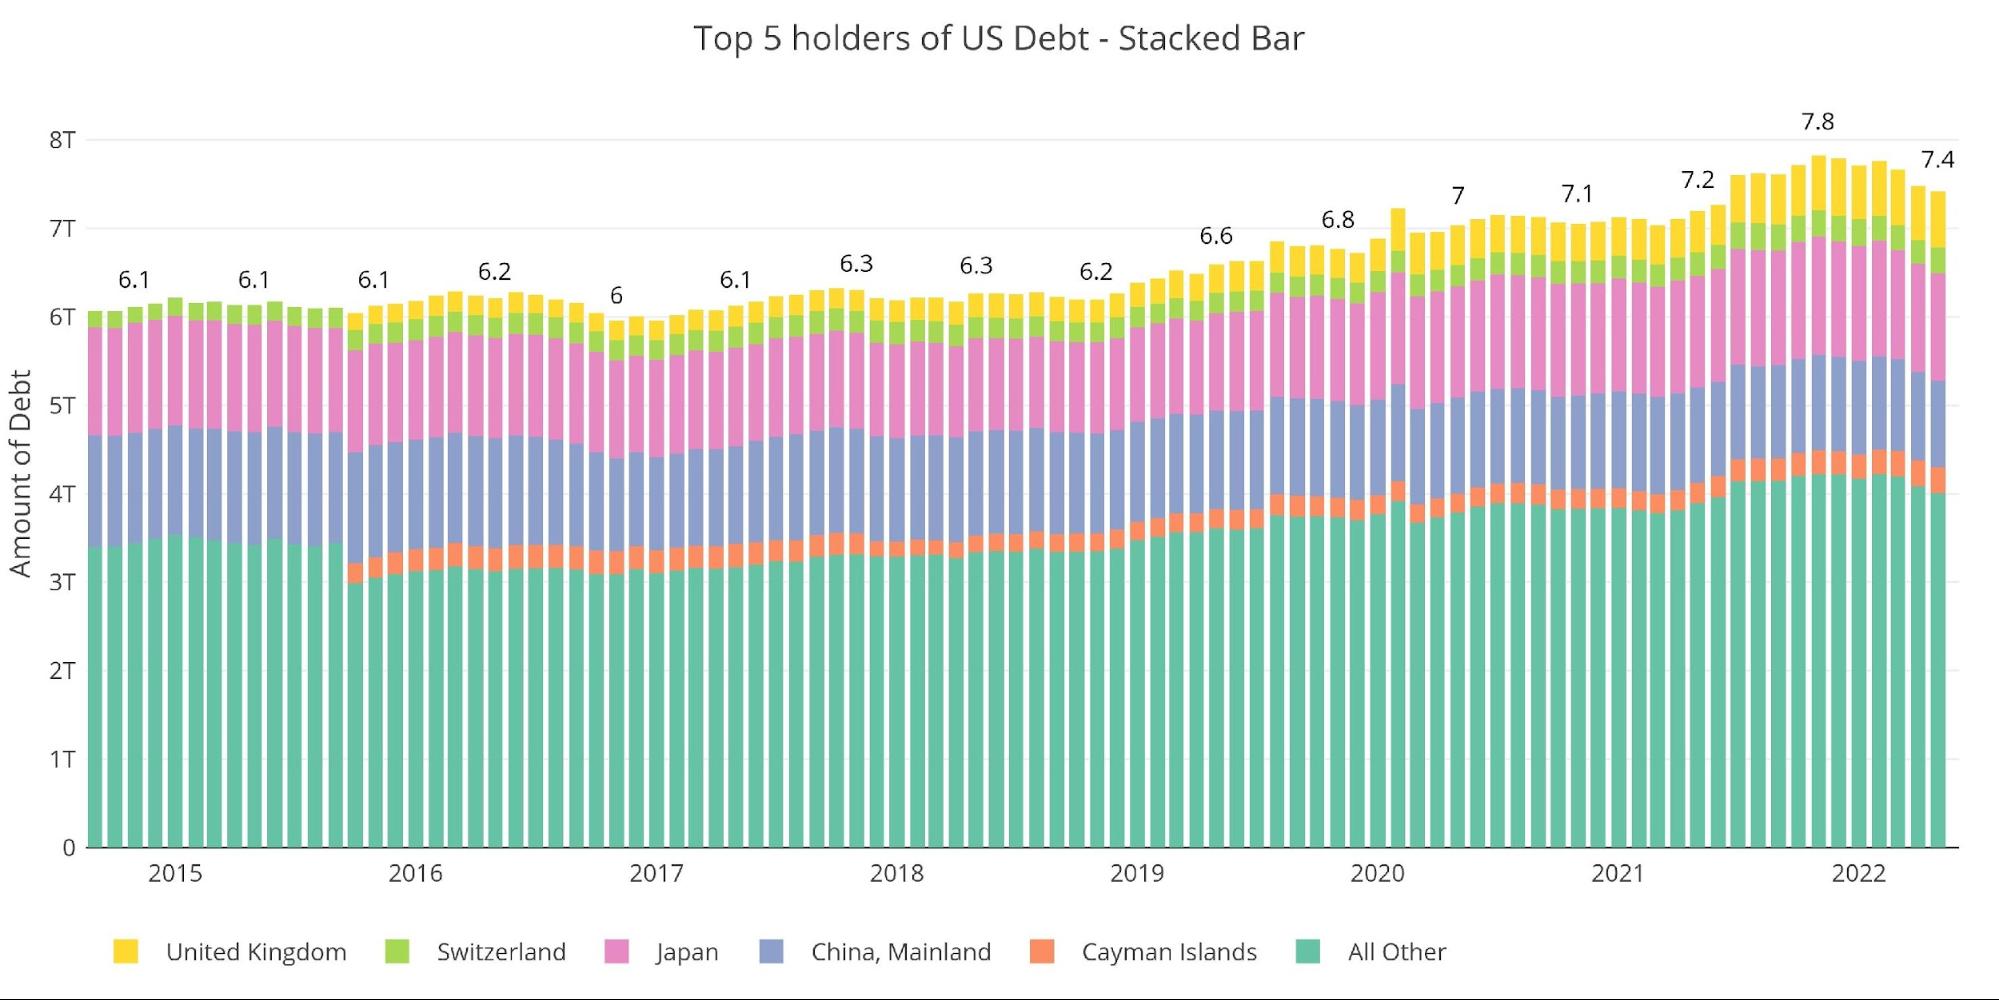
As the Fed leaves the market, someone will need to step in and purchase the debt the Fed had been buying. The chart below looks at international holders of Treasury securities. International holdings continue to fall rapidly. Because of the delay in reporting, the impact of the Ukraine war is only now being seen. International holdings are down by more than $400B since it peaked at $7.8T last November.
This is a major development that no one is talking about! International holders are now shedding US Treasuries at the fastest pace since at least 2015! China has seen holdings fall below $1T for the first time in over a decade.
Note: Data was last published as of May
Figure: 8 International Holders
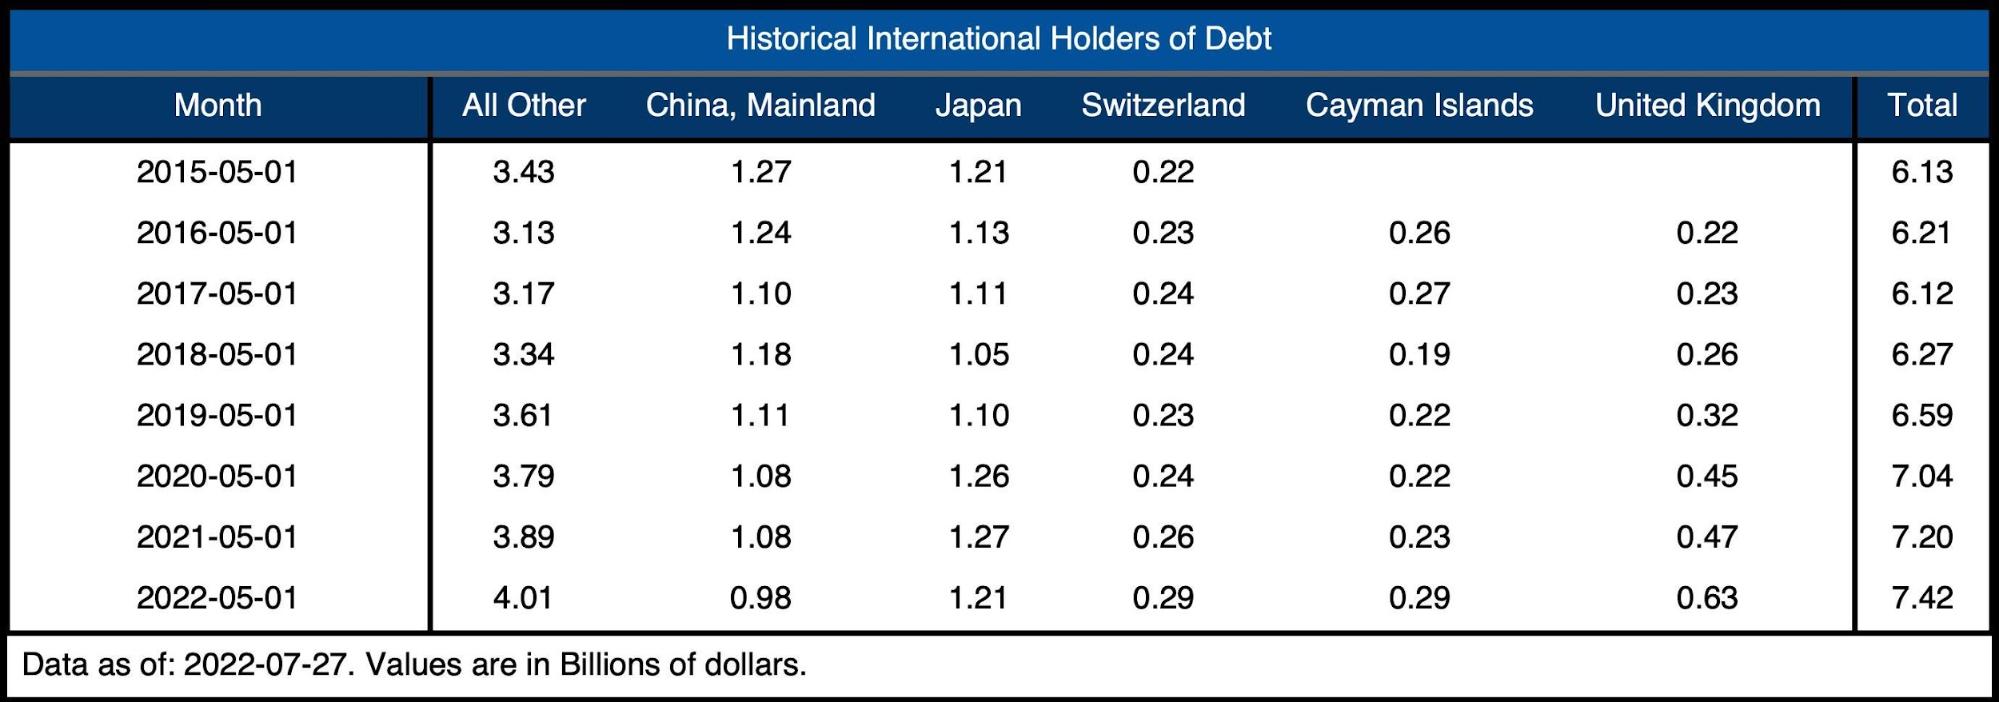
The table below shows how debt holding has changed since 2015 across different borrowers. While the net change is positive over the last year, there are some major countries reducing exposure. As mentioned, China is now below $1T and Japan has shed $60B in the last year alone.
Figure: 9 Average Weekly Change in the Balance Sheet
Historical Perspective
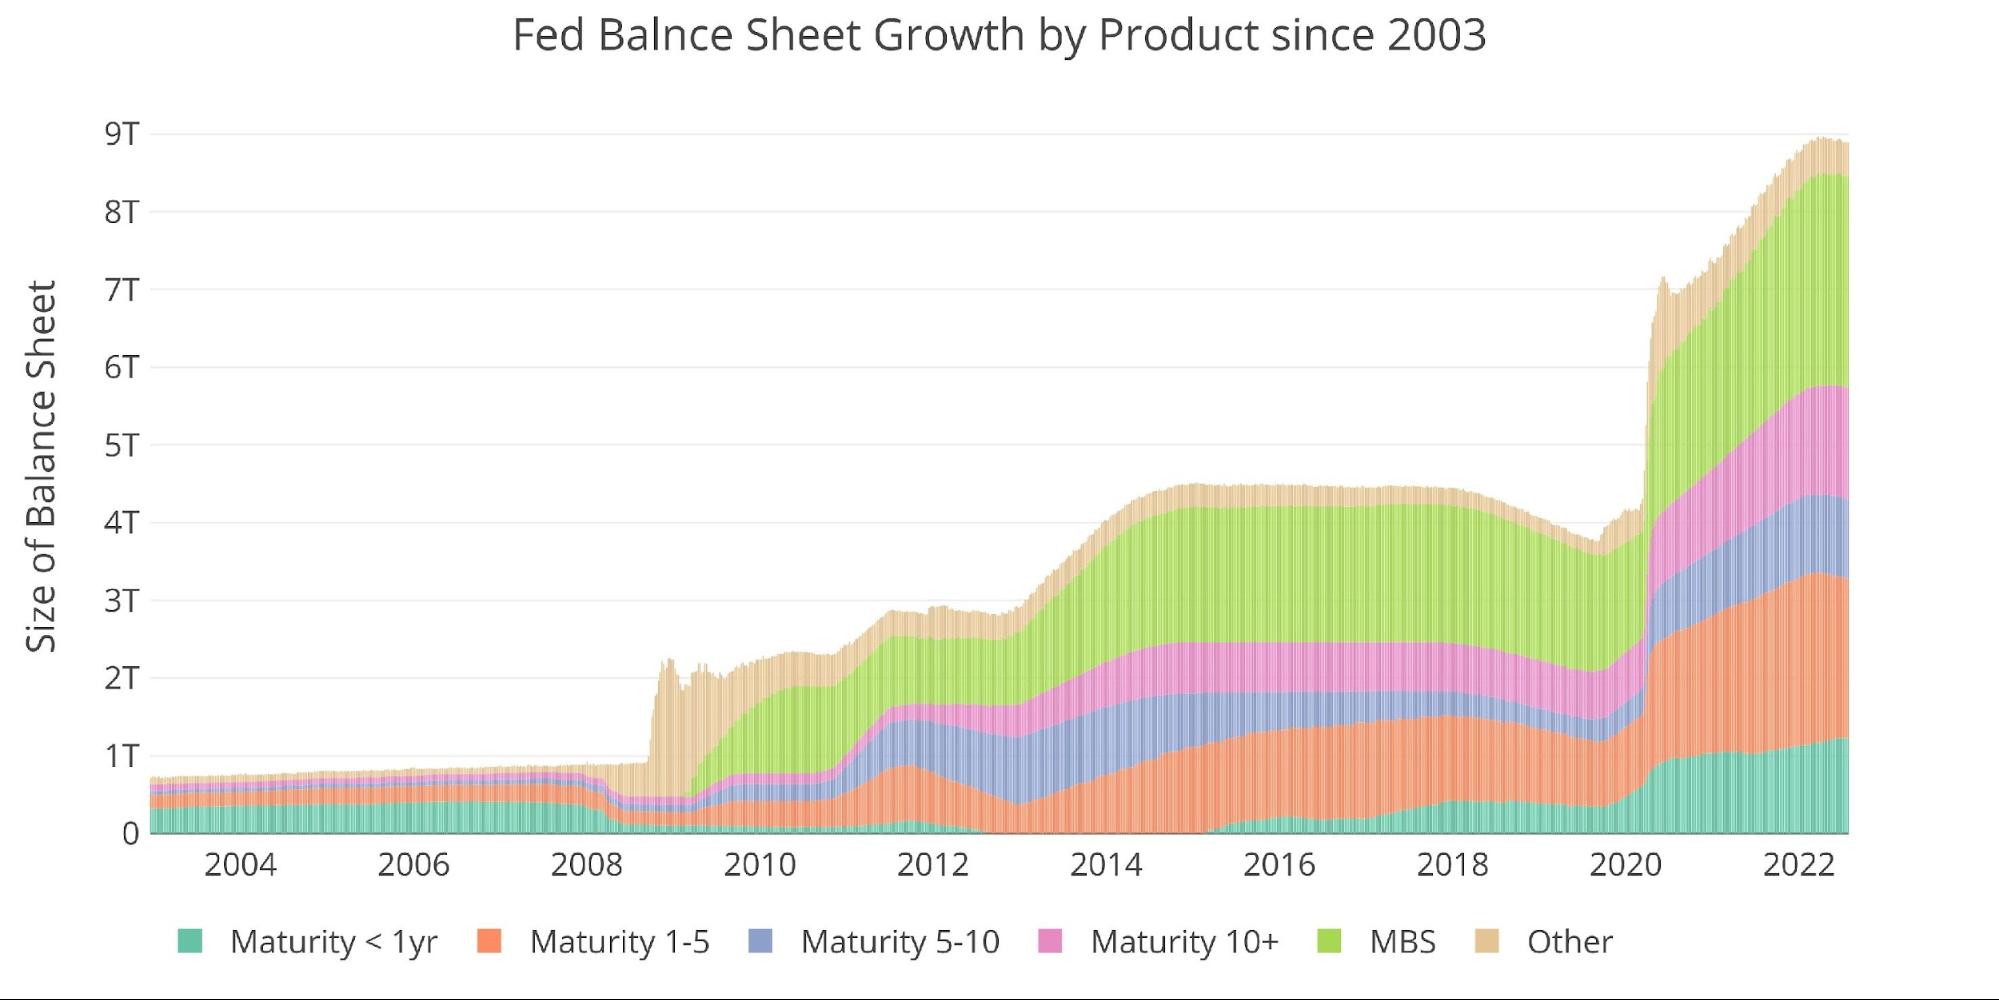
The final plot below takes a larger view of the balance sheet. It is clear to see how the usage of the balance sheet has changed since the Global Financial Crisis. The tapering from 2017-2019 can be seen in the slight dip before the massive surge due to Covid. It’s highly unlikely the new round of QT will last as long or shrink the balance sheet as much as it did in 2018.
During the last QT period, the Fed shrunk its balance sheet by ~15%. A similar reduction would be $1.34T. Even after QT hits full speed, this would take more than a year. Will the Fed continue QT as the economy flounders in a recession?
Figure: 10 Historical Fed Balance Sheet
What it means for Gold and Silver
Powell was out with the same message yesterday from the June press conference. “Inflation is public enemy number 1 and the Fed will do anything to stop it.” Unfortunately, the data tells a different story. Why is the Fed so slow to start QT? Powell is constantly talking about the strength of the economy. If this was the case, then why not begin QT now to stop inflation?
The Fed may be “aggressive” in interest rate hikes, but by their own admission, they were just front-loading hikes rather than raising the end target goal. The Fed cannot get much higher than they are now without really breaking something. They have likely already passed the point of no return, but can’t tell because of the delayed effects of interest rate hikes.
The Fed has already reached peak hawkish talk. Gold and silver have been crushed as the rhetoric for tight money got louder and louder. The sell-off may have already ended. Over the last week, it looked like the precious metal markets may have reached capitulation. Time will tell if the PMs need one more pullback or are ready to rip now, especially with a potential short squeeze based on the Commitment of Traders report.
Regardless of short-term timing, it’s clear the Fed is closer to the end than the beginning of its tight policy. More and more pundits are anticipating the Fed pivot. When the pivot happens, there could be nothing left to restrain gold and silver prices. The balance sheet will blow past $9T and $10T, while the current reduction will barely register on the charts.
Data Source: https://fred.stlouisfed.org/series/WALCL and https://fred.stlouisfed.org/release/tables?rid=20&eid=840849#snid=840941
Data Updated: Weekly, Thursday at 4:30 PM Eastern
Last Updated: Jul 27, 2022
Interactive charts and graphs can always be found here dashboard: here
More By This Author:
Is The Federal Reserve At The End Of Its Rope?
Money Supply Growth Rate Drops Below 2008
Consumer Confidence Hits 19-Month Lo


