
Equities Don’t Bottom When Yield Curves Are Inverted

Image source: Pixabay
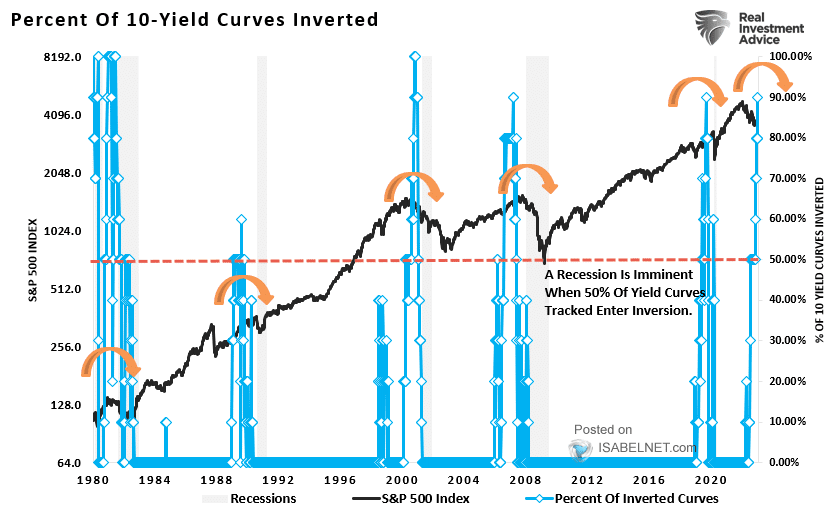
The percentage of global 2/10-year Treasury yield curves inverted at the end of 2021 (long rates lower than short) was 90% (as shown in blue below, courtesy of Lance Roberts). Historically, recessions (grey bars) and bear markets (S&P 500 in black) have followed when the number of inverted 10-year curves reached 50% (red dotted line).
Significantly, while recessionary bear markets (as shown by the S&P in grey below, courtesy of The Daily Shot) begin from inversions, stocks don’t bottom until central banks have slashed short rates enough to drop them back below long, re-steepening the curve to positive sloping once more. As shown below in blue, today, yield curves remain steeply inverted.
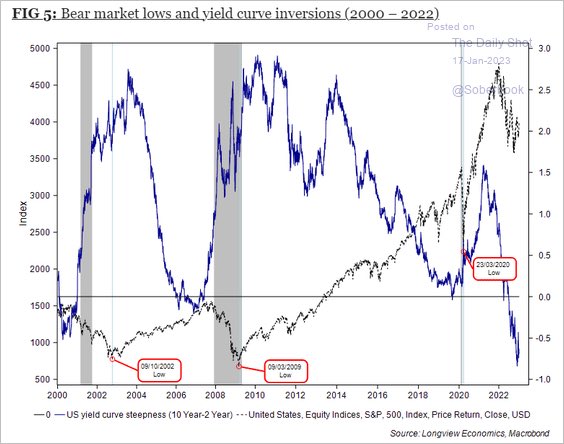
In its seventh month of inversion, yesterday’s much-watched 2/10 US Treasury yield closed at -71bps.
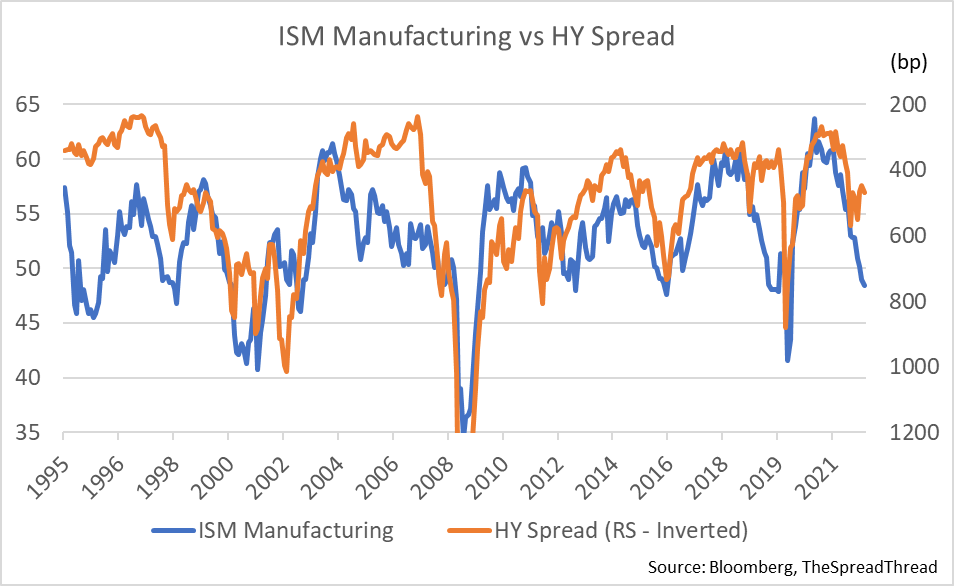
Meanwhile, high-yield corporate bond (HY) spreads ended yesterday at just 412 bps over similar-term treasuries. As shown below, since 1995, a contracting ISM manufacturing index (in blue) leads HY spreads wider (inverted below in orange) as defaults rise.
HY bond prices typically bottom with equities once HY yield spreads have reached 800+ bps above similar-term treasuries. HY prices have much more dropping yet to do.
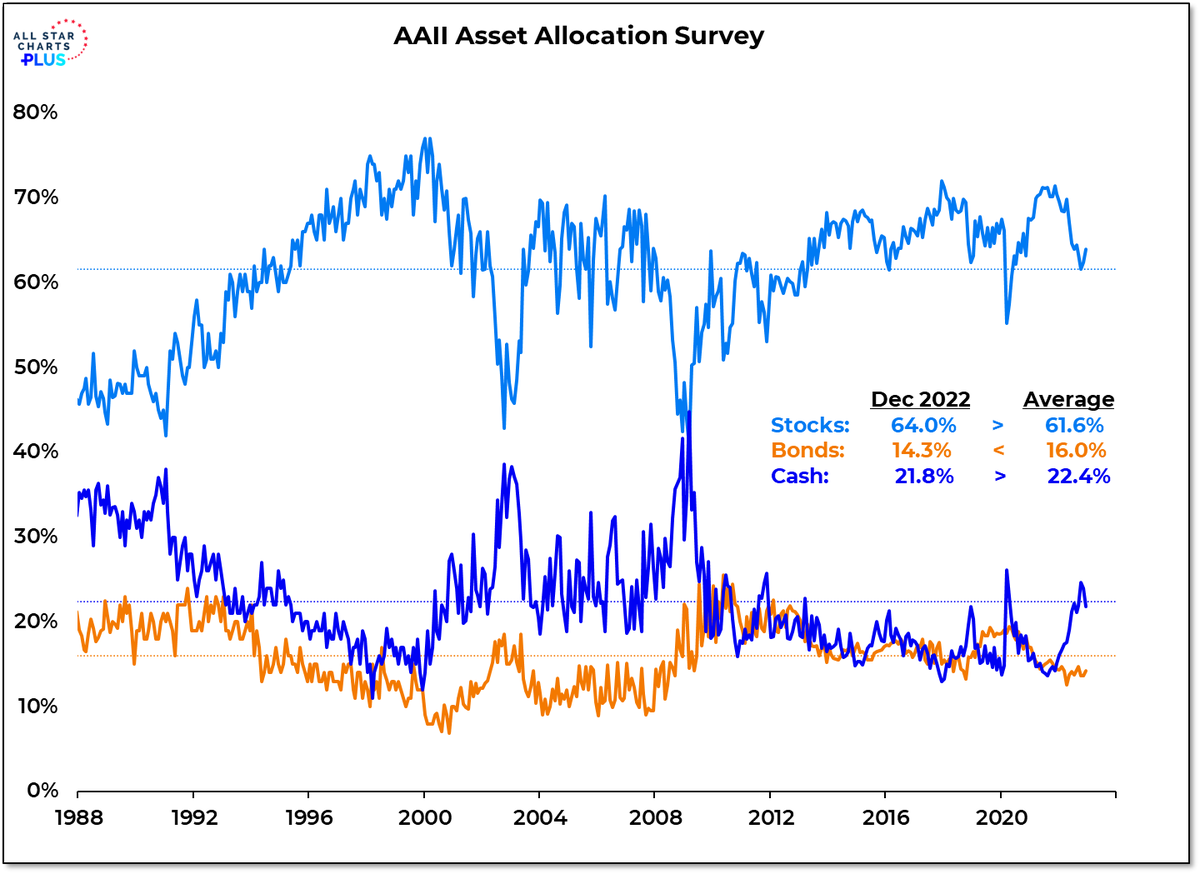
Further portfolio losses will hit hard for holders that came into 2023, 64% allocated to stocks (as shown in light blue below) with 14% in bonds (primarily corporate) and less than average cash levels. 1990, 2002, and 2009 market bottoms arrived once the allocation to stocks had fallen to 40% of portfolios.
Bottom line: no cycle bottom is yet in sight for the economy, risk assets, or the net worth of the masses. Word to the wise.
More By This Author:
Canada’s Housing Downturn Barely StartedMonetary Policy Changes Are Felt Slowly And Then All At Once
This Housing Bust Is Global


