
Distressed In Distressing Times
Jeff Gundlach has been recently quoted as asking, “the Fed can buy up corporate bond ETFs and thereby prop up prices of corporate bonds, but what happens when there are defaults and the artificial Fed price is replaced by the recovery value?”
We have already seen how the S&P U.S. Corporate Investment Grade Corporate Bond Index, an index of 7,000+ bonds whose constituents’ option-adjusted spread (OAS) topped out at 568 at the beginning of March 2020, now contains 99 bonds with an OAS greater than 1,000. Though not all are Energy sector bonds, 51 of the 99 are as the virus and the currently low price of oil take their toll on the economy and energy industry.1
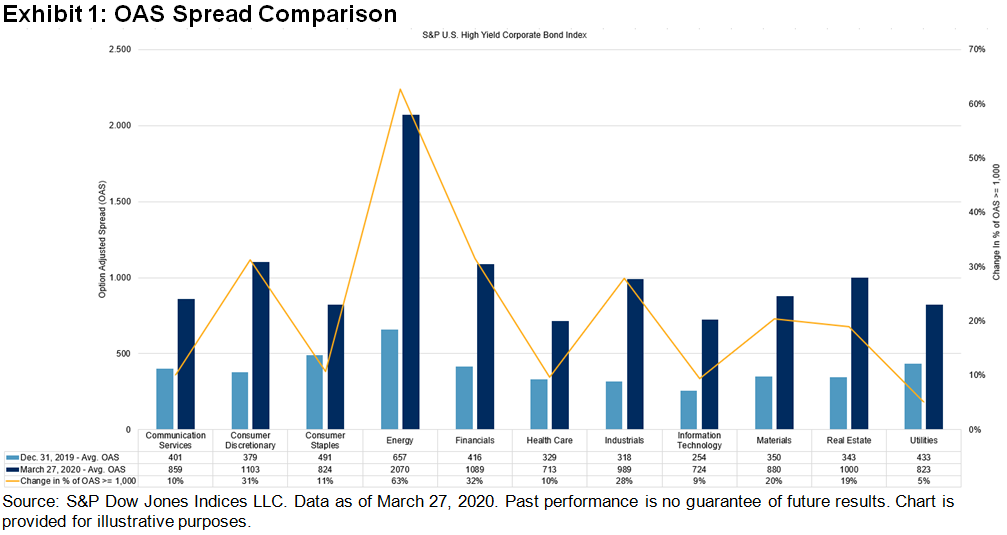
Moving down the credit scale and looking at more speculative-grade securities, the effects are even greater. Year to date, the S&P U.S. High Yield Corporate Bond Index has seen a fair amount of spread widening, as seen in Exhibit 1. In addition to the movement in OAS spreads, the amount of debt per sector that is at or above an OAS of 1,000 (distressed) has also increased since the beginning of the year. Distressed bonds will be an early indicator of issuers that may end up in default.
(Click on image to enlarge)
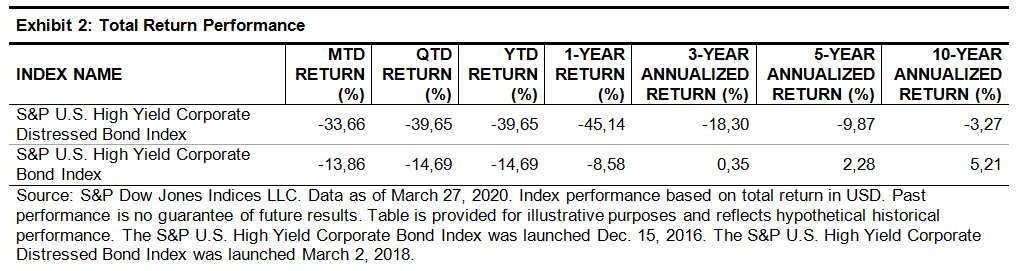
The S&P U.S. High Yield Corporate Distressed Bond Index is a sub-index of the S&P U.S. High Yield Corporate Bond Index, which focuses on bonds whose OAS are 1,000 or greater. The negative effects of the current market can be seen in its performance as the index is down more than twice as much as its parent index on both a month-to-date and year-to-date basis.
(Click on image to enlarge)
(Click on image to enlarge)
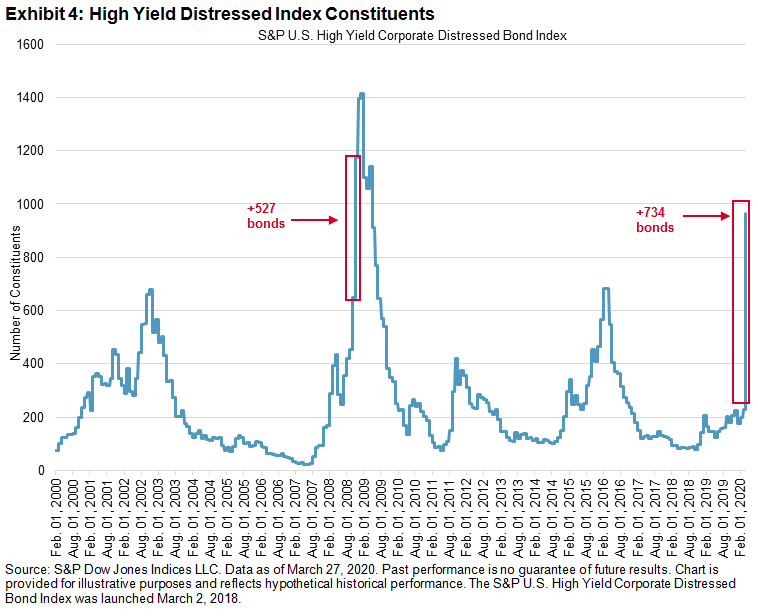
The S&P U.S. High Yield Corporate Distressed Bond Index, when measured on a market-weighted basis, accounts for 3.8% of its benchmark index, though since its first value date on Jan. 31, 2000, it has averaged 9.6% and was as high as 77% on Dec. 31, 2008.
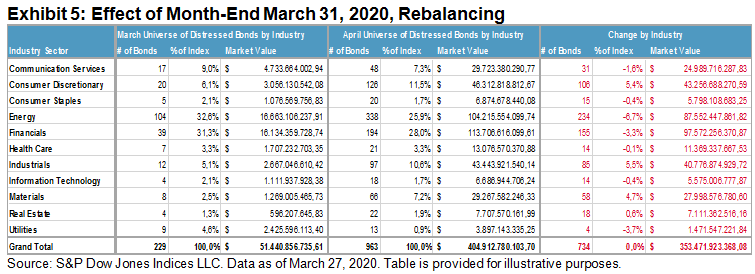
As can be seen in Exhibit 4, the index is going to jump from its current 229 bonds to 963 bonds at the March 31, 2020, rebalancing. This will be the largest number of bonds entering the index at a rebalancing since the Oct. 31, 2008, rebalancing. The percent of distress within high yield will be 30% of market value, or 963 bonds out of the high yield April universe of 2,314 (42%).
(Click on image to enlarge)
As the market scenario plays out after the sudden stop of economic activity due to the COVID-19 pandemic, distressed and defaulted debt will likely continue to be an ongoing concern.
Exhibit 5 breaks down the influx of bonds by industry.
(Click on image to enlarge)
The S&P U.S. High Yield Corporate Distressed Bond Index gives a window into credits that are struggling and the issuers that may eventually end up in default.
S&P Global Ratings said the default rate for high-yield, or junk, bonds is heading to 10% over the next 12 months, more than triple the rate of 3.1% that closed out 2019.
“The current recession in the U.S. this year is coming at a time when the speculative-grade market is historically vulnerable to a liquidity freeze or an earnings drop,” Nick Kraemer, head of S&P Global Ratings Performance Analytics, said in a statement.
The information provided is for informational purposes only and investors should determine for themselves whether a particular service or product is suitable for their investment needs. Graphs and ...
more
Comments
 No Thumbs up yet!

